The Rearmament Economy: Who Builds, Who Buys—and Who Pays?
How Ukraine and Iran Are Reshaping the Global Defence Economy
Russia's full-scale invasion of Ukraine brought industrial-scale attrition back to Europe. The 2026 conflict with Iran has exposed a different weakness: the limited supply of high-end missiles and interceptors. Together, the two shocks are turning emergency procurement into a global industrial cycle whose benefits and costs extend far beyond defence companies.
The Stratos Brief Deep Dive | Data cut-off: 20 August 2026
At a glance
Global military expenditure reached $2.887 trillion in 2025, up roughly one quarter in real terms from 2021.
The SIPRI Top 100 arms producers generated $679 billion in arms revenue in 2024, only about 5% more in real terms than in 2021, revealing a substantial lag between budgets, orders and delivered production.
European military expenditure reached $864 billion in 2025, while EU defence investment is estimated to rise by almost 159% between 2021 and 2026.
Ukraine expanded potential defence output from approximately $1 billion in 2022 to more than $35 billion by 2025, although around 40% of that capacity still lacked financing.
The 2026 Iran conflict has accelerated demand for Patriot, THAAD, Tomahawk and other high-end weapons, but headline contract ceilings are not the same as money already spent or missiles already delivered.
Defence expansion can support output, employment, investment and innovation. Its fiscal and social effects depend heavily on whether purchases are made domestically or imported, and whether governments use taxes, borrowing or cuts elsewhere to pay for them.
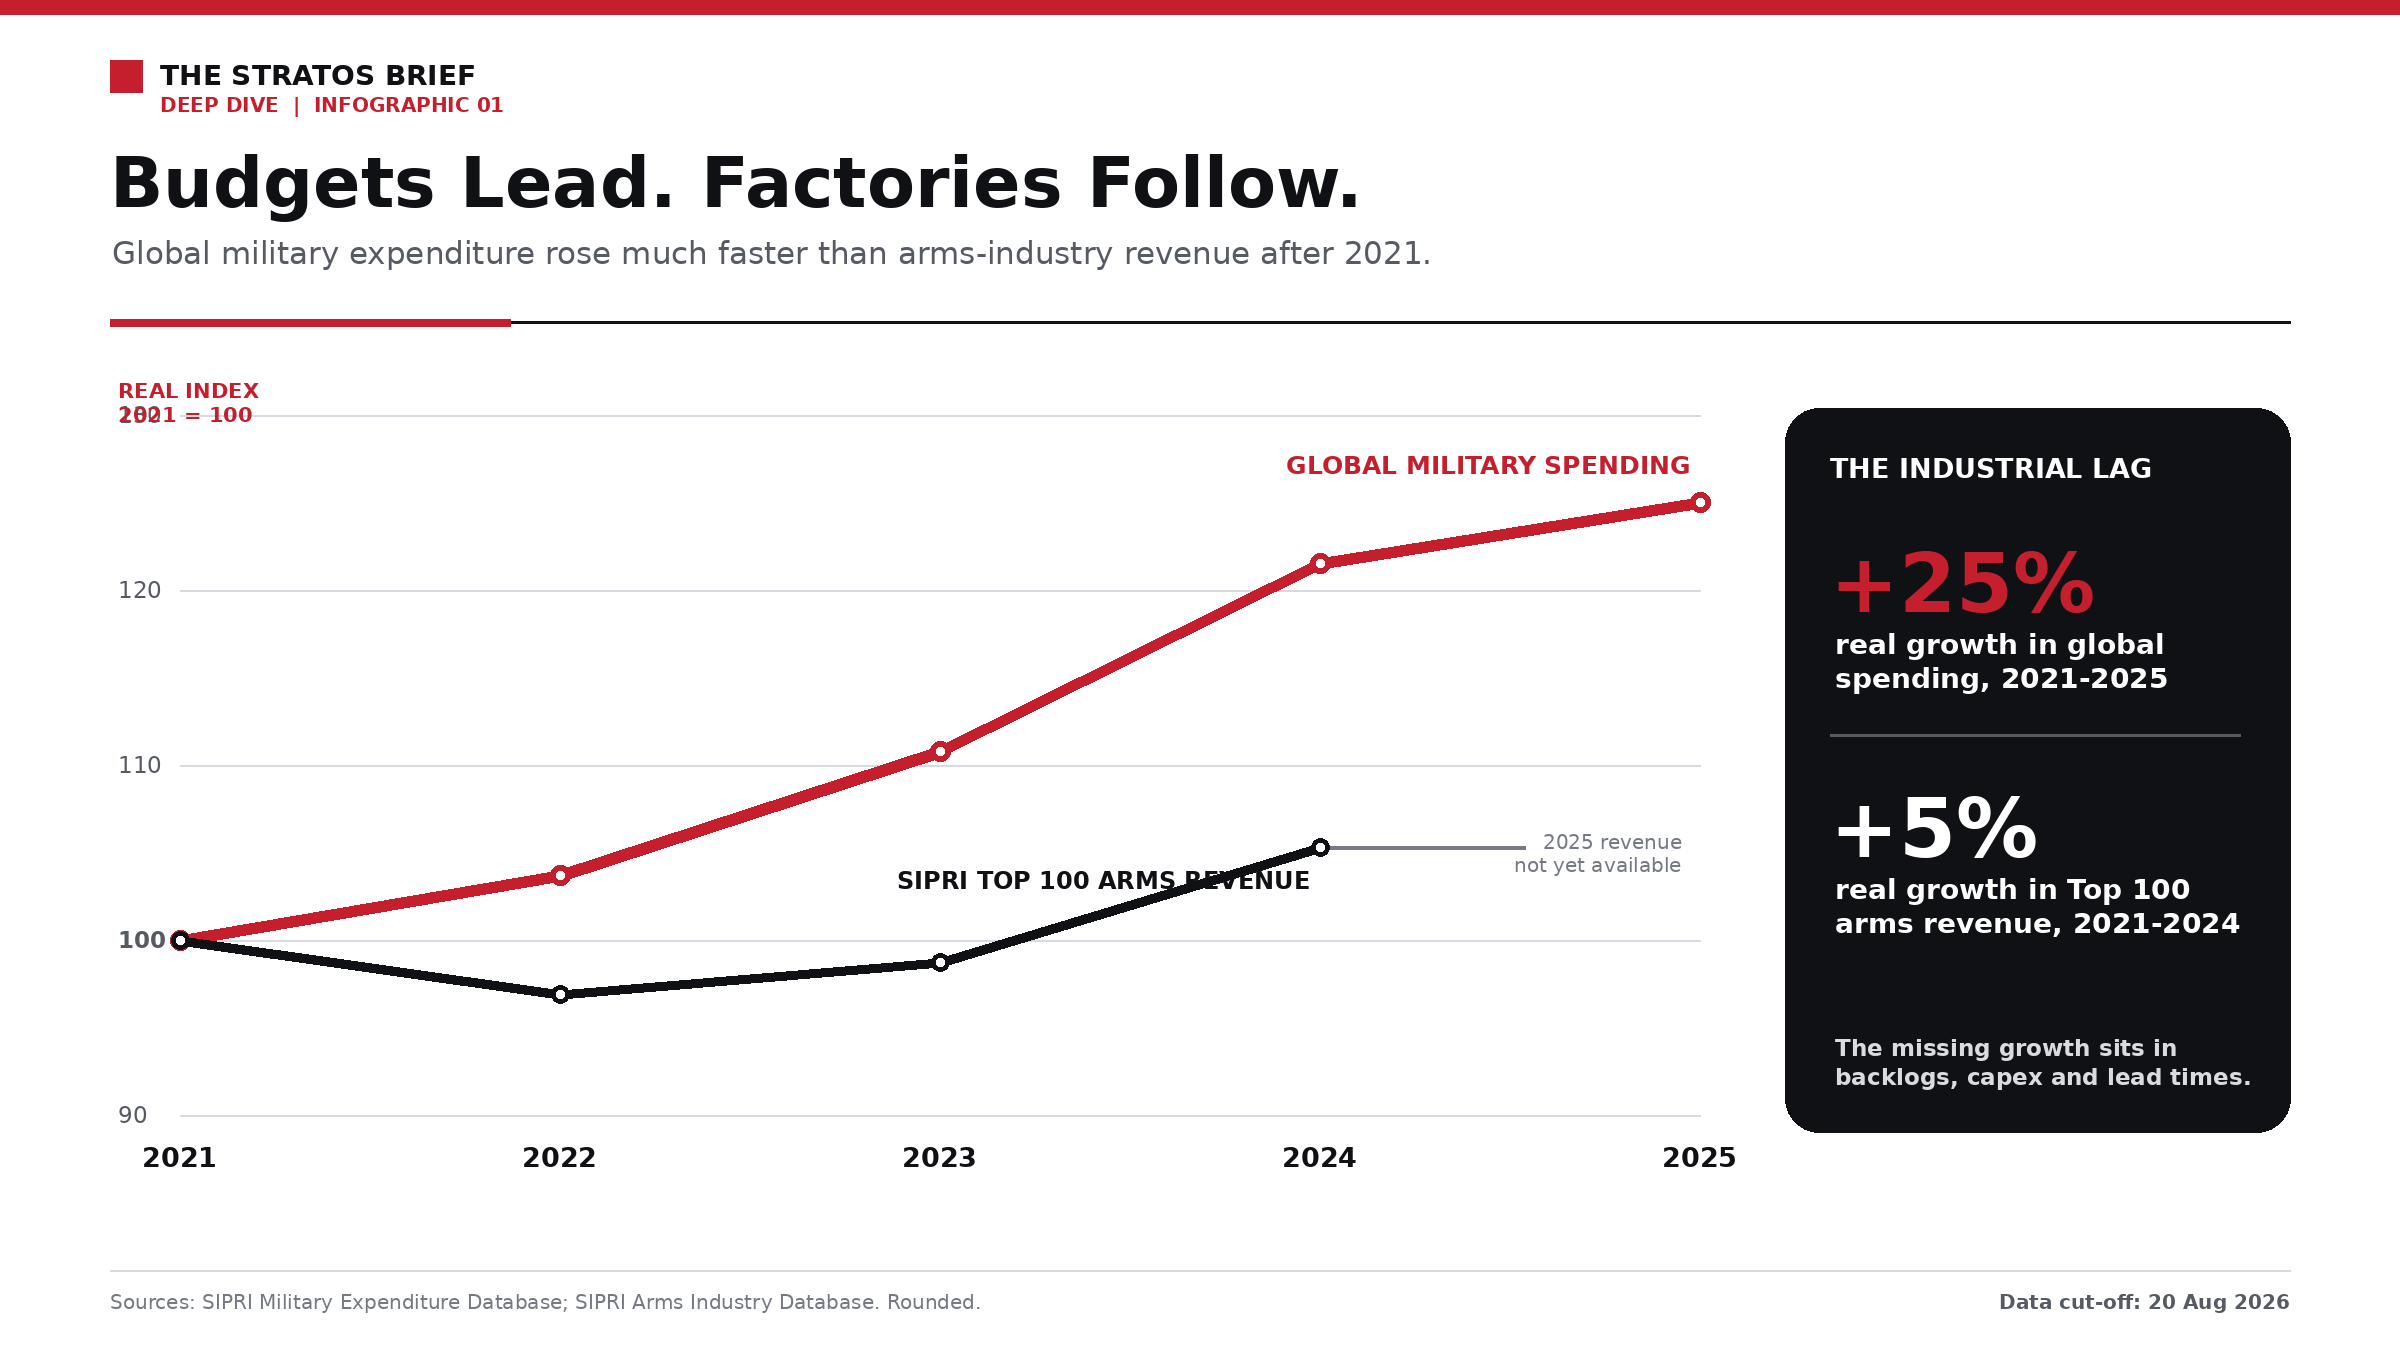
Global military expenditure rose roughly 25% in real terms between 2021 and 2025, while the SIPRI Top 100's arms revenue increased by only about 5% between 2021 and 2024. The gap reflects the delay between budgets, orders, factory investment and delivered production.
One war reopened the factories. Another exposed the shelves.
For much of the post-Cold War period, Western defence planning treated industrial capacity as something that could be rebuilt after a crisis began. Governments bought sophisticated platforms in relatively small annual batches, contractors optimised their networks for efficiency rather than surge production, and stockpiles were calibrated around limited campaigns instead of years of high-intensity warfare. Russia's full-scale invasion of Ukraine in February 2022 overturned that model. It demonstrated that even technologically advanced militaries could consume artillery ammunition, drones, air-defence missiles and armoured vehicles at a pace that peacetime production lines were never designed to replace.
The second shock arrived in a different form. The US-Israeli conflict with Iran that began on 28 February 2026 did not primarily recreate the enormous artillery demand seen in Ukraine. It stressed inventories of high-end interceptors, long-range precision weapons, naval munitions, electronic warfare systems and the components needed to manufacture them. The resulting pressure is economically important because these systems are expensive, technically demanding and slow to expand. A factory can add shifts relatively quickly; a new rocket-motor supplier, energetics plant or qualified seeker-production line may require years of investment, testing and regulatory approval.
The global defence boom must therefore be understood as a transmission process rather than a single spending number. A security shock changes political priorities; governments then approve budgets, place orders and negotiate multi-year frameworks; companies invest in plants, workers and suppliers; and only later does this capacity produce equipment and recognised revenue. Each stage can be delayed, reduced or cancelled. The distinction explains why defence budgets have risen far faster than arms-industry sales and why the largest part of the industrial effect may still lie ahead.
This is also why the boom cannot be evaluated solely through defence-company earnings. Higher military spending can create skilled employment, revive manufacturing regions, expand research and increase national resilience. At the same time, it can increase debt, absorb scarce engineers and materials, worsen the current account of import-dependent countries, or force difficult budget choices. None of these outcomes is automatic. The result depends on what is purchased, where it is produced, how long the expansion lasts and, above all, how it is financed.
Before 2022: growth without mobilisation
The defence industry was not dormant before the invasion. Global military expenditure had already increased for seven consecutive years by 2021, reaching $2.113 trillion, while strategic competition between the United States and China, nuclear modernisation, instability in the Middle East and rising Asian budgets supported a broad but gradual expansion. China's military expenditure has now increased for 31 consecutive years, illustrating that the current cycle cannot be attributed solely to Ukraine. The pre-2022 world was already rearming; what changed after February 2022 was the speed, composition and political durability of demand.[1][2]
In constant 2024 dollars, arms revenue among the SIPRI Top 100 stood at approximately $645 billion in 2021. US companies dominated the ranking, European groups remained substantial but fragmented, and Chinese state-owned enterprises had become major producers for a large domestic customer. Yet much of the Western industrial base was still organised around relatively predictable annual procurement, low-rate production and long lead times. The COVID-19 shock had also disrupted electronics, castings, transport and labour availability, which meant the sector entered the Ukraine war with less supply-chain flexibility than headline corporate capacity suggested.[3]
Europe embodied the peacetime model most clearly. Several countries maintained capable national champions, but demand was split across numerous tank, aircraft, frigate, missile and communications programmes. Small order runs protected national industrial autonomy while sacrificing scale. Stocks of ammunition and spare parts often functioned as budget buffers because they were less politically visible than major platforms. The United States possessed a much deeper industrial base, but it too had concentrated production around a limited number of prime contractors and specialised suppliers, with critical components sometimes available from only one qualified source.
This structure was rational under the assumptions of the period. Maintaining idle factories and duplicate suppliers is expensive, while weapons have finite shelf lives and changing technical standards. The mistake was not efficiency itself, but the belief that efficiency and surge resilience could be separated indefinitely. Once sustained attrition returned, governments discovered that money could be authorised far more quickly than explosives, rocket motors, ships or skilled workers could be produced.
The numbers trap: a budget is not a weapon
Military expenditure, procurement, arms-industry revenue and physical output measure different things. SIPRI's expenditure totals include personnel, operations, construction, military pensions and certain forms of assistance as well as equipment purchases. A country can therefore raise its military budget sharply without creating an equivalent increase in revenue for weapons manufacturers. Conversely, a company may record sales based on an order funded several years earlier, while a stockpile transfer can support an ally immediately without initially creating a new factory order.
The contract language used during the 2026 US production drive makes this distinction especially important. A multi-year indefinite-delivery or framework contract may establish a maximum value that the government is legally able to order, subject to appropriations and later task orders. It does not mean that the full ceiling has been obligated, spent or recognised as corporate revenue. Backlog is closer to committed future work but still differs from delivered output, while an announced production target describes capacity that may not yet exist.
These categories should never be added together as though they represented the same pool of money. The clean analytical sequence is budget authority -> funded order -> company backlog -> capital investment -> production -> delivery -> recognised revenue. The post-2022 boom is visible at every point in this chain, but the growth rate becomes smaller and the data less immediate as one moves from political commitments toward finished equipment.
That lag is the first central finding of this Deep Dive. Multiplying SIPRI's reported annual real changes shows that global military expenditure rose by roughly 25% between 2021 and 2025. Over the shorter period for which company data are available, the Top 100's constant-dollar arms revenue moved from about $645 billion in 2021 to $679 billion in 2024, a rise of only about 5%. Revenue actually fell in 2022 before recovering in 2023 and accelerating in 2024. The difference is not evidence that the boom is illusory; it is evidence that industrial conversion is slow.[1][3]
The first shock: Ukraine and the return of mass
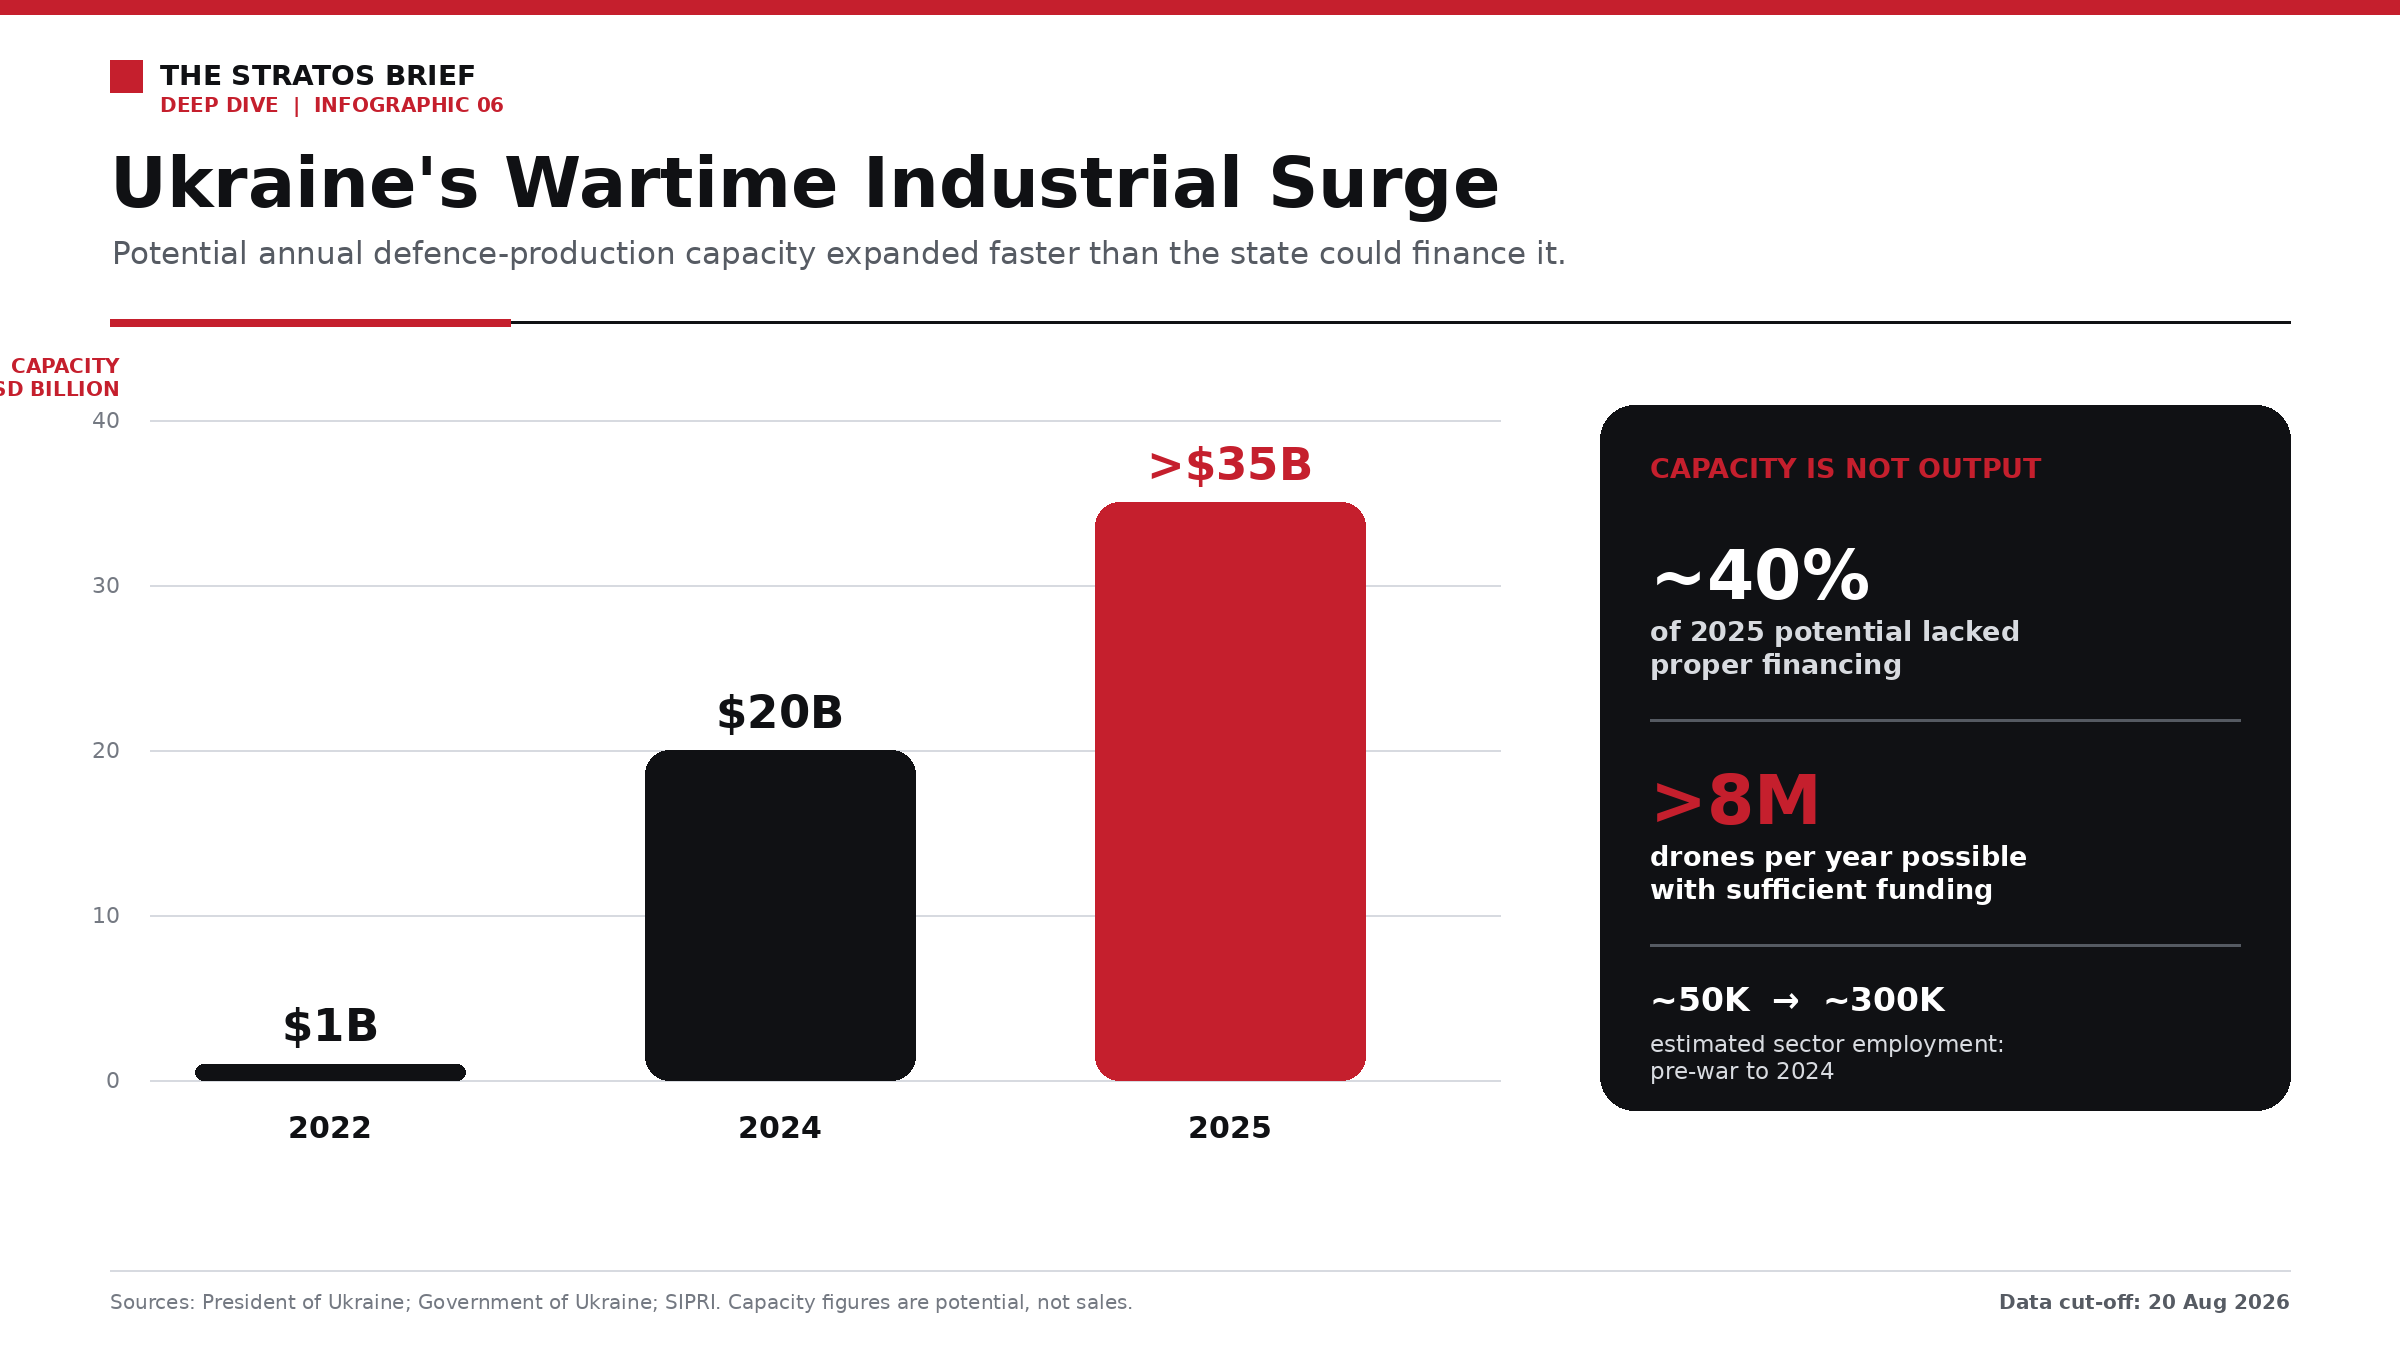
Ukraine's potential defence-production capacity grew from about $1 billion in 2022 to more than $35 billion in 2025. Around 40% of the 2025 potential nevertheless lacked proper financing.
The war in Ukraine restored demand for scale across categories that had received limited investment for decades. Artillery ammunition became the most visible symbol, but the requirement extended to gun barrels, propellants, explosives, armoured-vehicle repair, short-range air defence, loitering munitions, electronic warfare and the industrial systems needed to assemble millions of small drones. Both sides learned that inexpensive uncrewed systems could supplement or destroy far more costly platforms, while neither side could dispense with conventional mass.
Europe's response moved through several stages. Governments first transferred equipment from existing stocks, then placed replacement orders, financed additional Ukrainian purchases and began underwriting capacity expansion. EU member-state defence expenditure reached EUR 418 billion in 2025 and is estimated at EUR 454 billion in 2026, 75.3% above the 2021 level. The investment component grew faster: EUR 134 billion in 2025 and an estimated EUR 163 billion in 2026, almost 159% above 2021. NATO's 2025 Hague commitment, which combines at least 3.5% of GDP for core defence with up to 1.5% for wider security and resilience by 2035, could sustain this cycle well beyond the immediate replacement of equipment sent to Ukraine.[5][6]
Yet higher European spending does not translate automatically into European production. Imports by European NATO members increased 143% between 2016-20 and 2021-25, with the United States supplying 58% of the imported major weapons. South Korea, Israel and France were other important sources. Imported systems can close operational gaps faster and improve interoperability, but their industrial stimulus is captured primarily by the exporting country. Europe's policy challenge is therefore not simply to spend more, but to decide how much urgency it is willing to trade for domestic capacity, joint procurement and longer-term autonomy.[7]
Ukraine's own industrial transformation is even more dramatic. Before the full-scale invasion, the sector consisted of roughly 50 major enterprises employing around 50,000 people. By 2024, estimates pointed to approximately 500 producers and 300,000 employees, with a new private ecosystem emerging around drones, software, electronic warfare and rapid battlefield adaptation. Potential production capacity rose from around $1 billion in 2022 to about $20 billion in 2024 and more than $35 billion in 2025. However, capacity is not the same as financed output: official Ukrainian statements indicated that only about $6 billion of the 2024 capacity was covered by orders, while roughly 40% of the larger 2025 potential still lacked funding.[8][9]
This gap makes Ukraine an unusual case. It has one of the world's strongest immediate demand signals, short feedback loops between operators and engineers, and an ability to iterate products in weeks. It also faces attacks on infrastructure, dependence on foreign components and capital, and a military burden estimated at 40% of GDP in 2025. Foreign-funded procurement inside Ukraine, often described through the Danish model, can simultaneously deliver equipment to the front and preserve the industrial learning generated by the war. Without reliable multi-year financing, however, factories can possess technical capacity that remains unused.
The second shock: Iran and high-end attrition
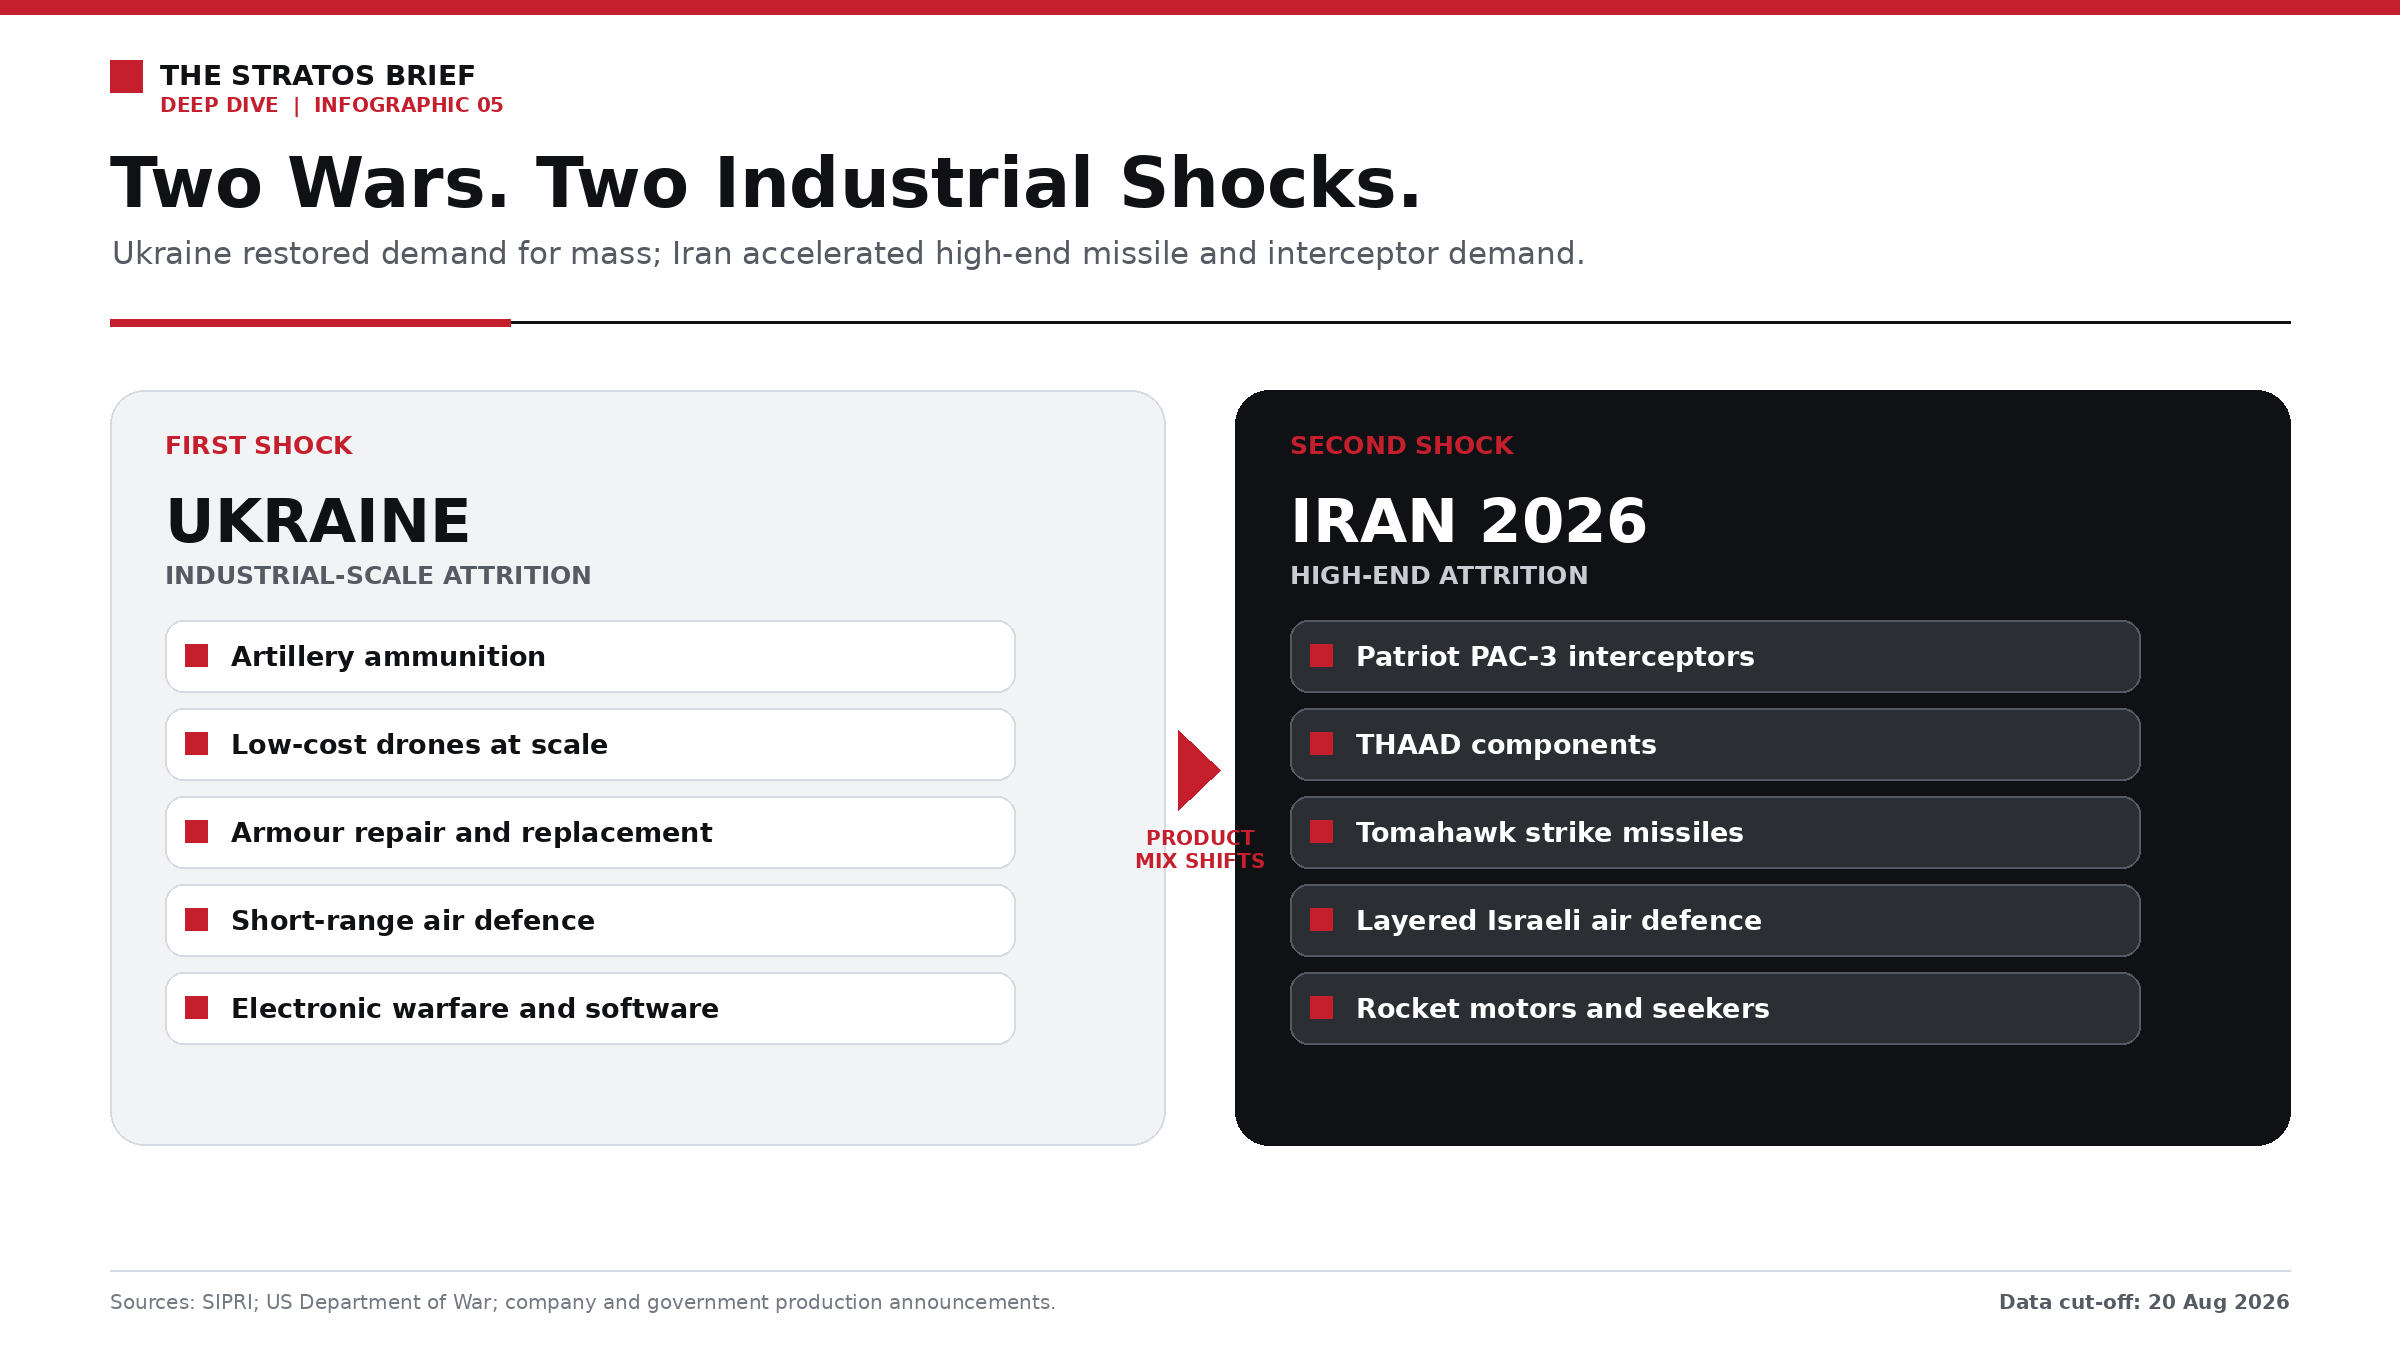
Ukraine and Iran are stressing different parts of the industrial base. Ukraine restored demand for mass and relatively low-cost volume, while the Iran conflict accelerated consumption of high-end interceptors and precision weapons.
Operation Epic Fury began on 28 February 2026 as a US military campaign conducted alongside Israeli action against Iran. Whatever the political interpretation of its objectives, its industrial effect was immediate: it demonstrated the rate at which an advanced force could consume long-range precision weapons and the rate at which layered air defence could consume interceptors. It also created a direct link between operational expenditure in the Middle East and future availability for Europe and the Indo-Pacific.[14]
The US response is moving beyond ordinary annual procurement. The Army awarded Lockheed Martin a Patriot PAC-3 MSE framework with a ceiling of up to $58.6 billion through fiscal 2032, while the company outlined a path toward roughly 2,000 interceptors annually. A separate THAAD award carried a maximum value of approximately $35.3 billion through 2032, although only $842.9 million was obligated at the time of award. The Navy's seven-year Tomahawk agreement with RTX has a potential value of $22.9 billion and is intended to raise output from about 60 missiles per year to more than 1,000. Additional agreements are designed to triple production of important Patriot components and quadruple parts capacity for THAAD.[15][16][17]
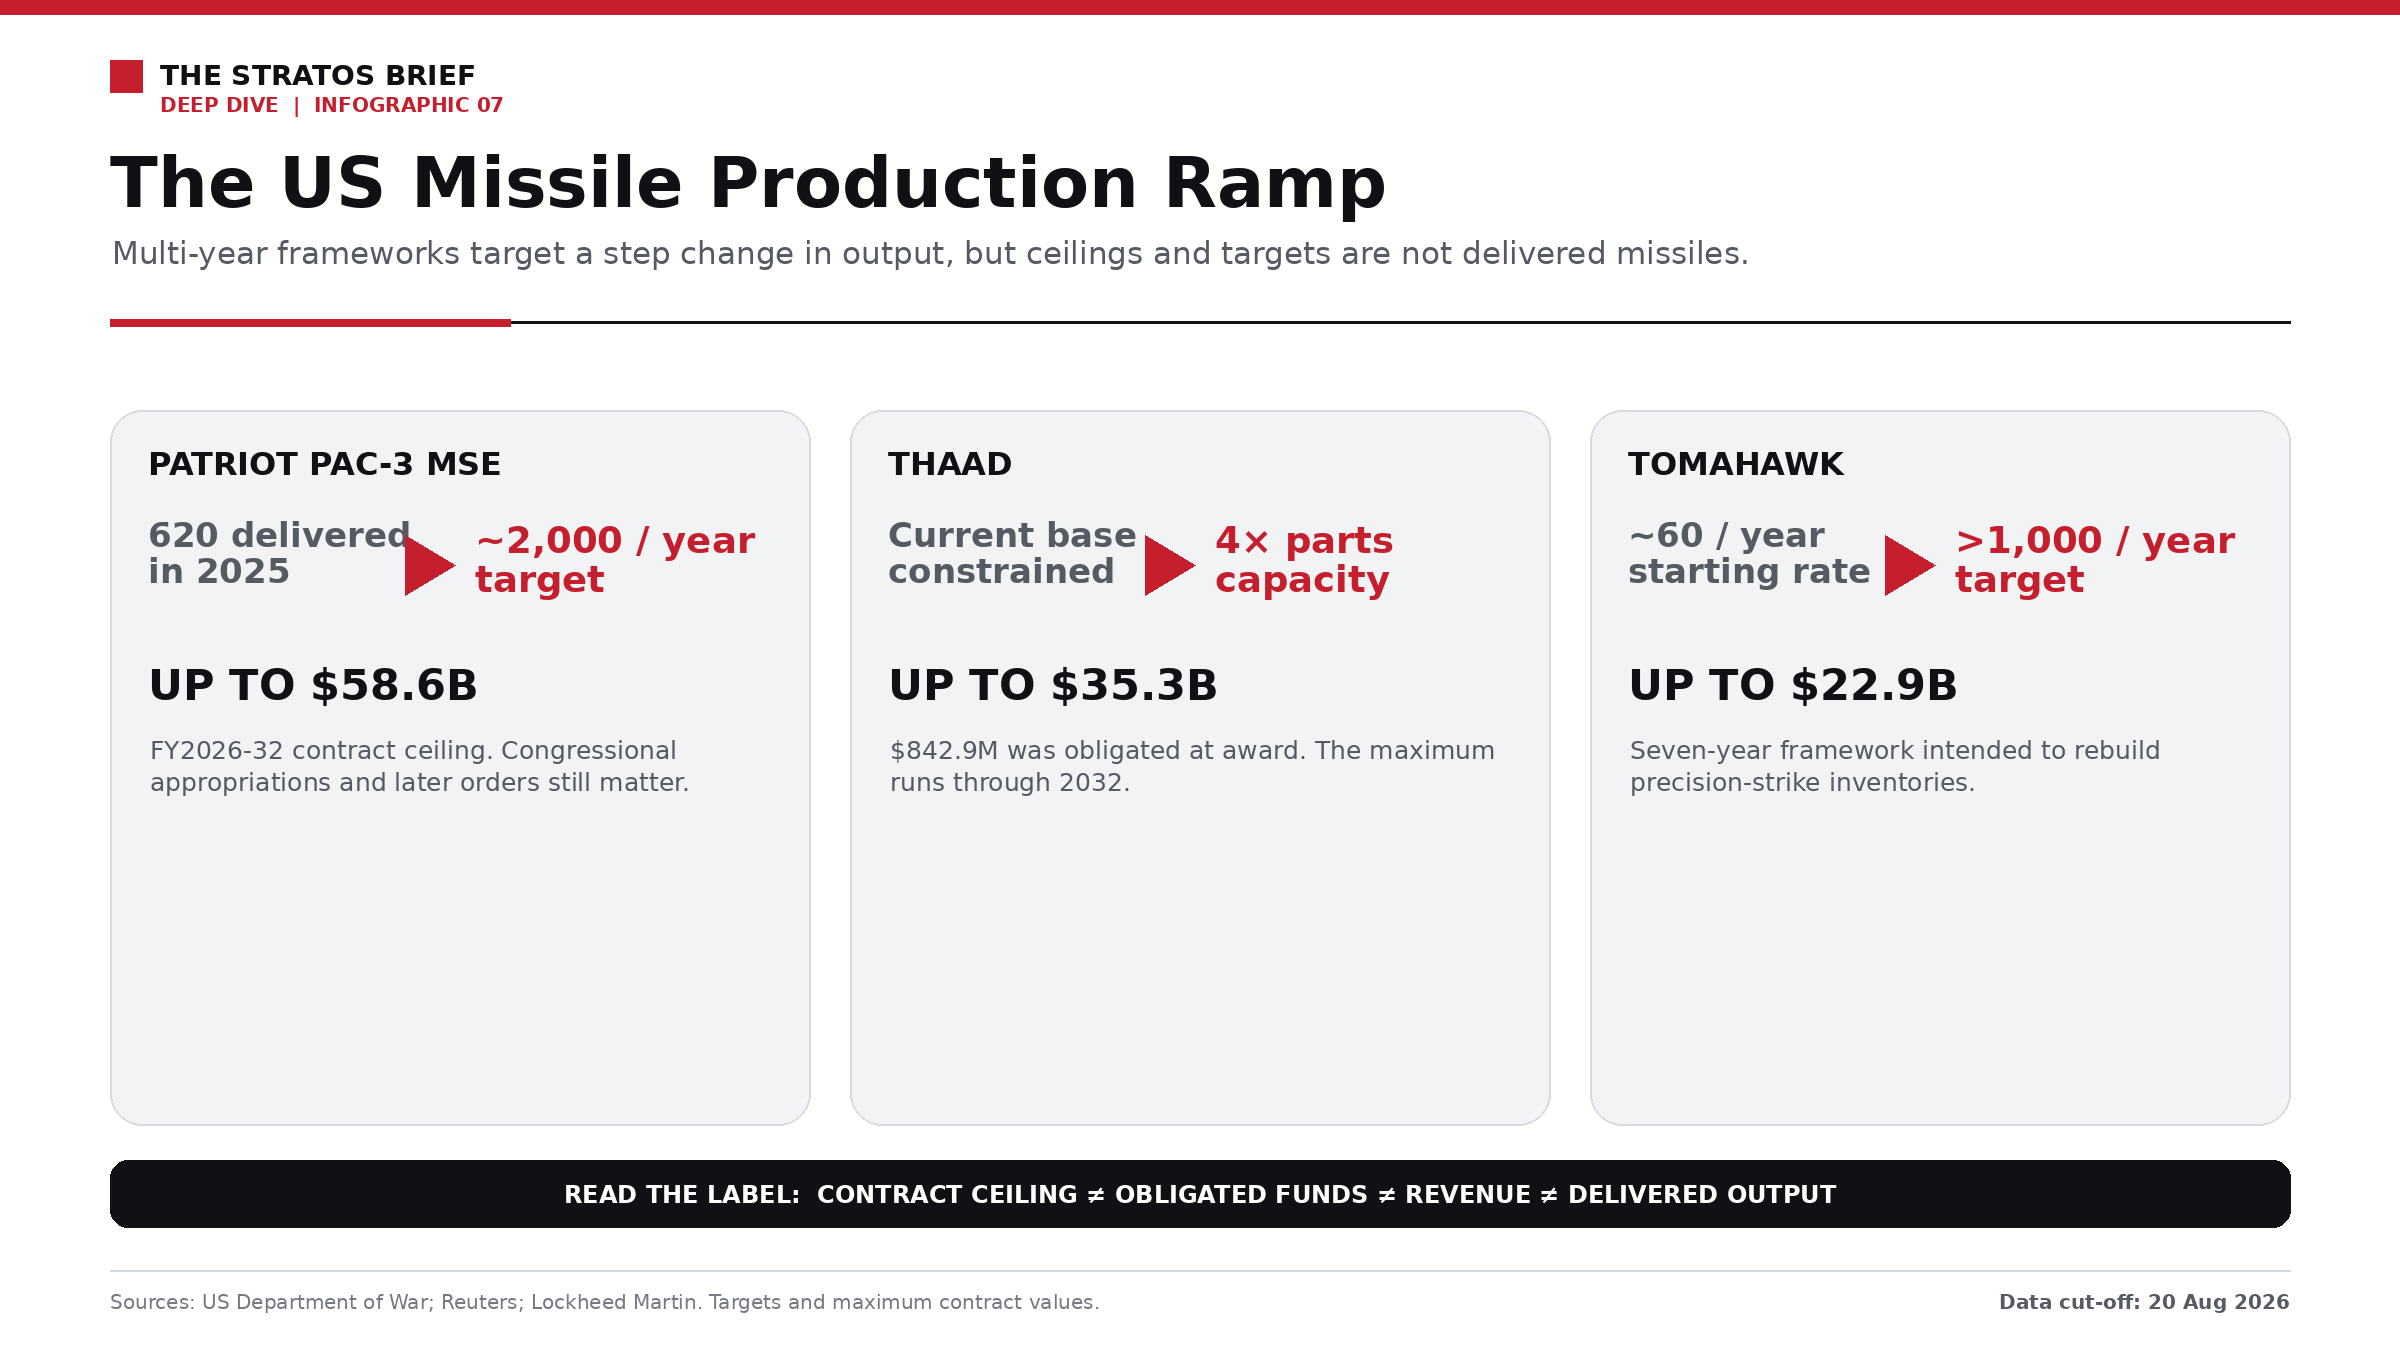
The United States is using multi-year frameworks to support a step change in missile production. The values shown are maximum contract ceilings and production targets, not current annual spending or delivered output.
These figures show the magnitude of the intended industrial shift, but they require careful reading. Contract ceilings overlap with component agreements, depend on later appropriations and cover multiple years. Production targets describe where the Pentagon and industry want to go, not the missiles available today. Their significance lies less in the sum of the headlines than in the new procurement model: long-duration commitments are being used to give contractors enough certainty to build facilities, qualify second sources and hire workers.
The product mix also matters. Ukraine's first shock rewarded businesses able to produce large volumes at sustainable cost, including artillery rounds and inexpensive drones. The Iran shock adds strong demand for systems in which each unit may be technically complex and costly. This intensifies the economic case for lower-cost interceptors, directed energy, electronic countermeasures and weapons that can defeat drones or cruise missiles without using a premium interceptor against every target. In industrial terms, the second wave is both a replenishment programme and a search for a more affordable defence architecture.
The effects extend beyond defence. The World Bank projected that the Middle East war would lift energy prices by 24% in 2026 and overall commodity prices by 16%, with large increases in fertiliser prices. These are forecasts rather than final outcomes, but they show how a conflict that creates missile orders in the United States or Israel can simultaneously raise transport, food and electricity costs for households and businesses far from the battlefield.[18]
A world rearming at different speeds
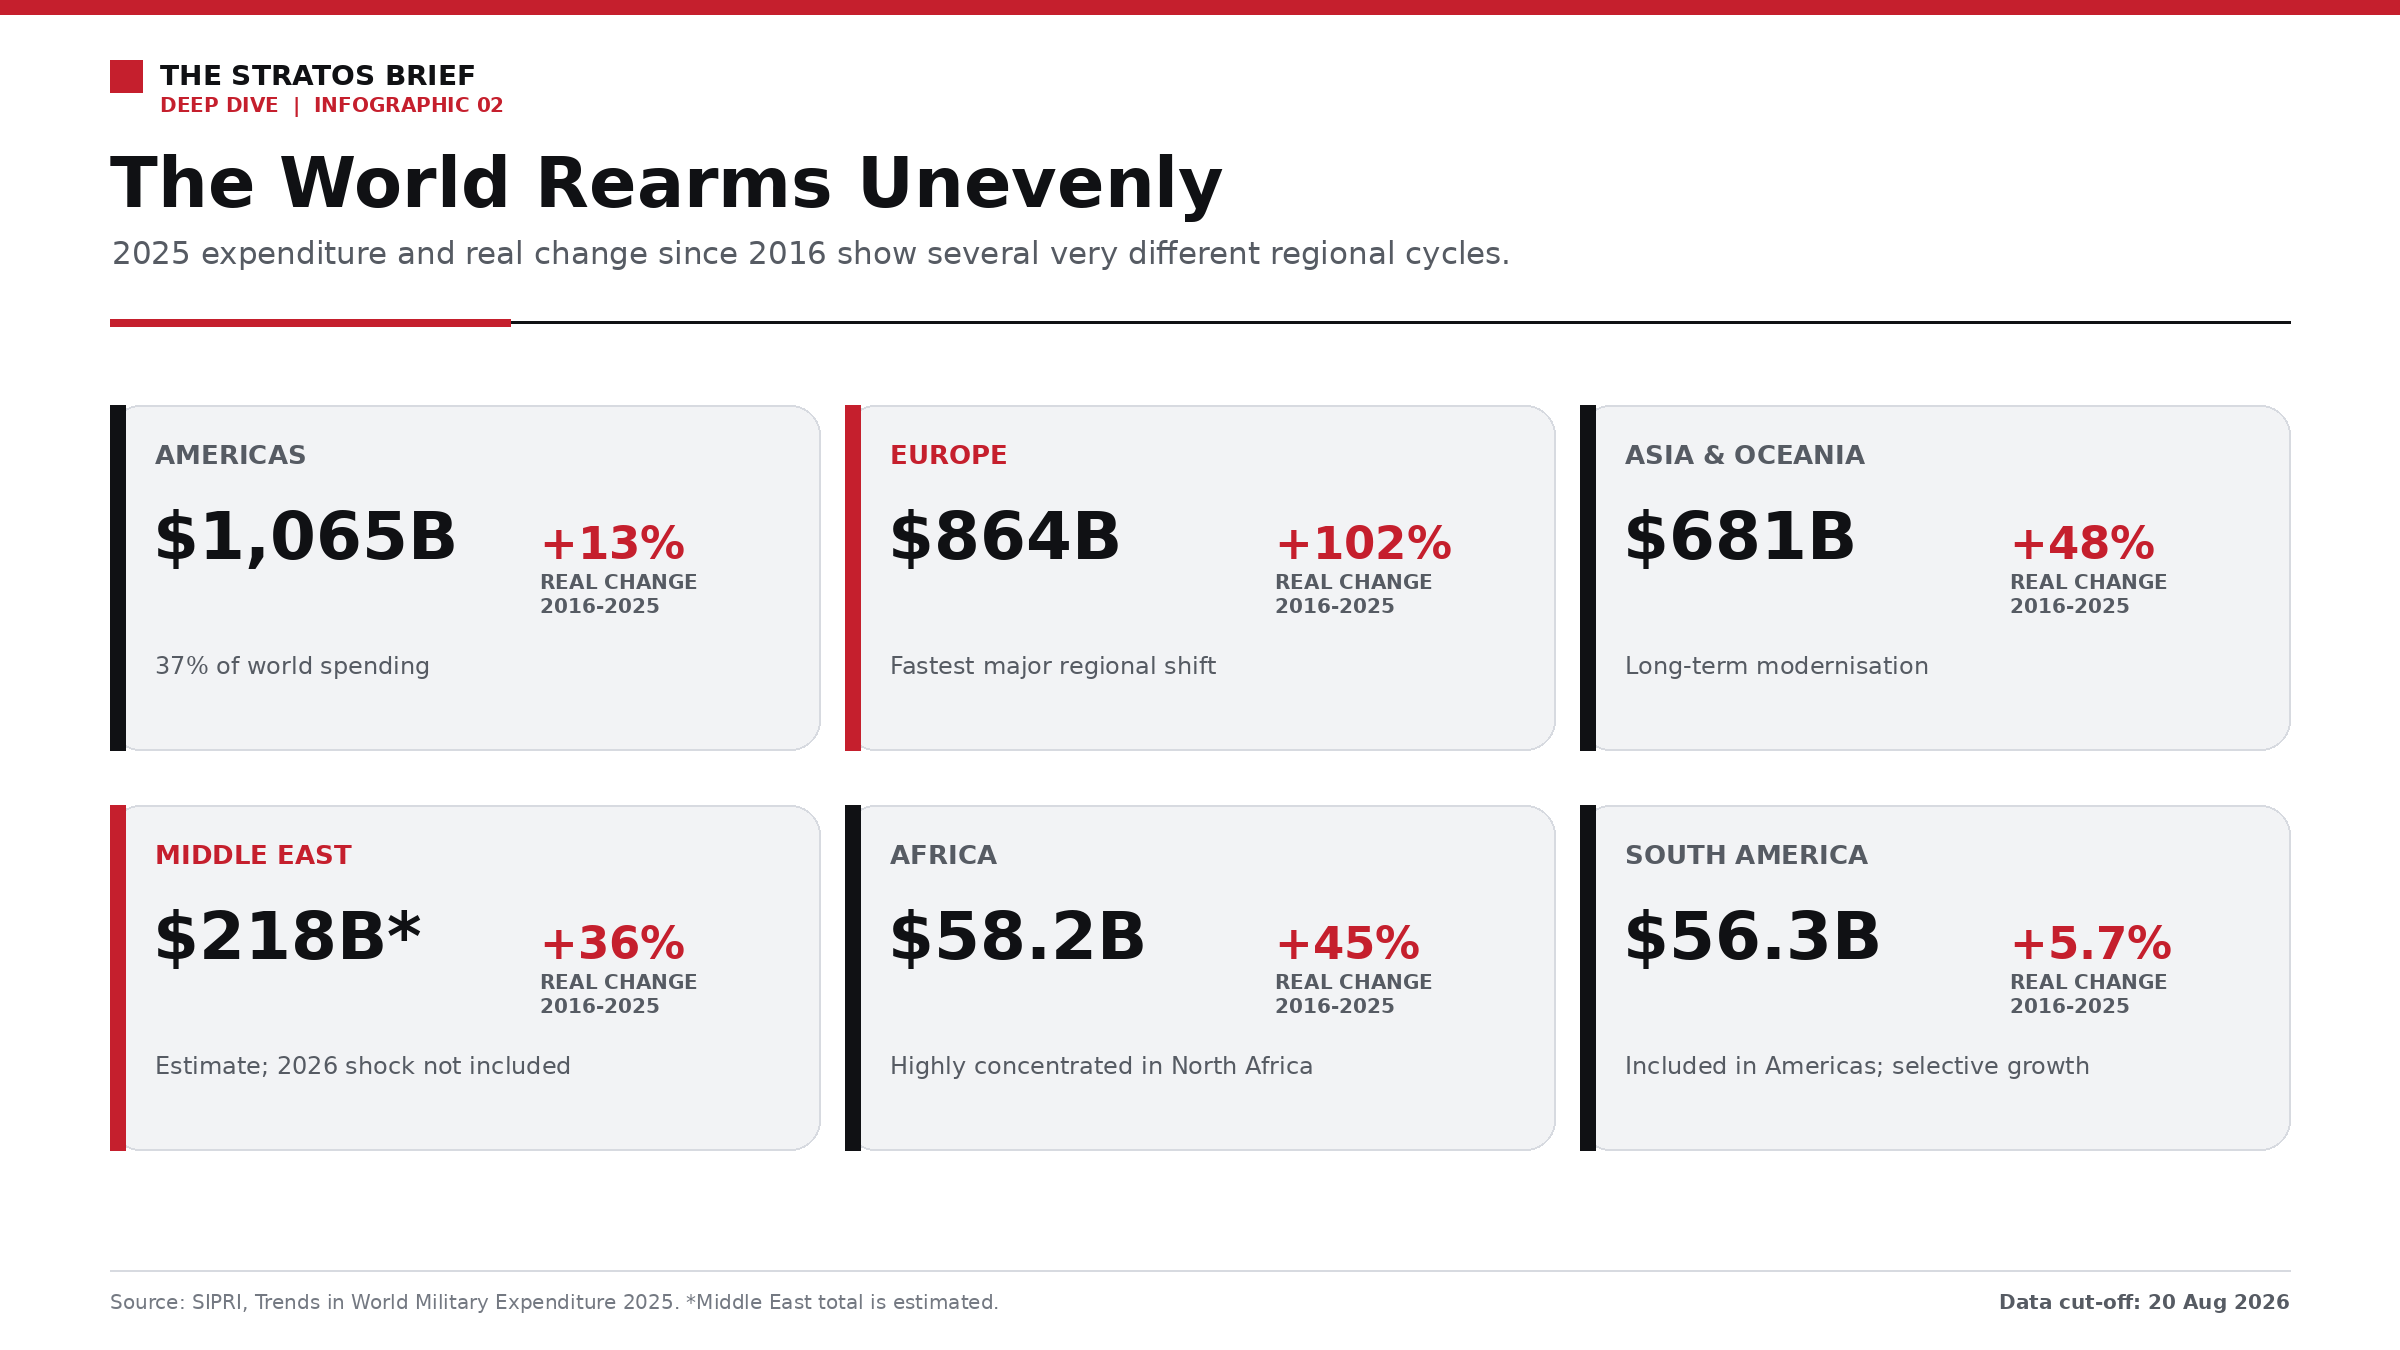
The global defence expansion is uneven. Europe recorded the strongest major regional growth over 2016-2025, while South America's increase remained comparatively limited.
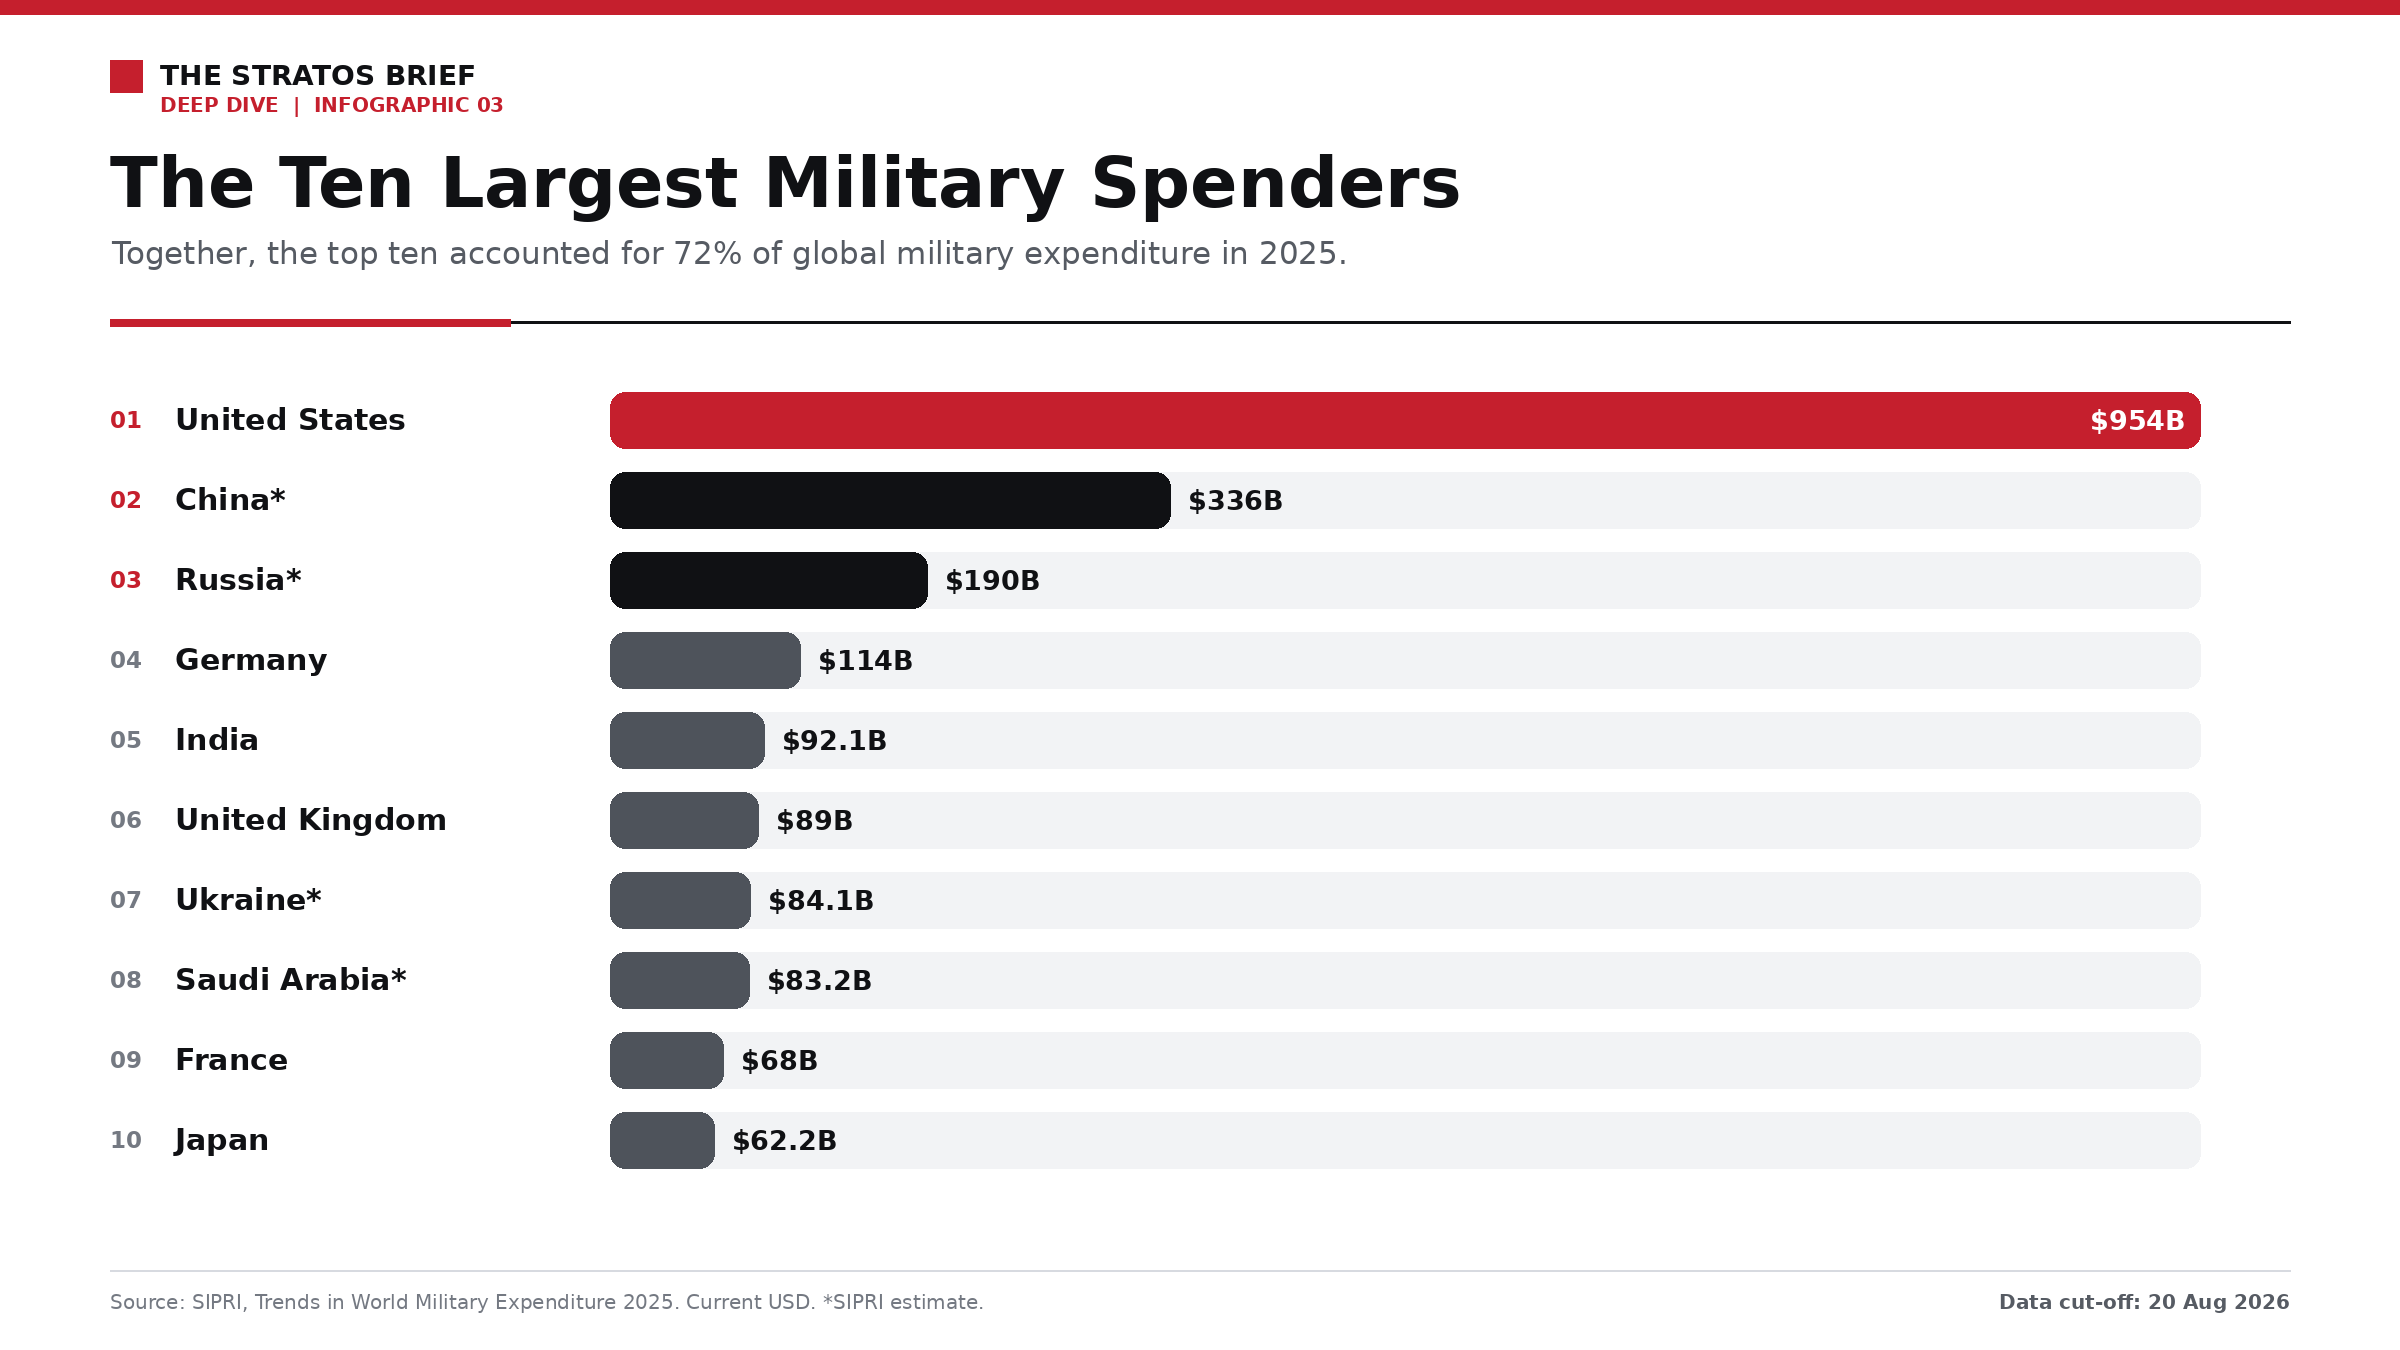
The ten largest military spenders accounted for 72% of the global total in 2025, with the United States alone representing one third.
The global total conceals sharply different regional stories. Europe doubled military expenditure in real terms between 2016 and 2025, while Eastern Europe increased it by 173%. Asia and Oceania rose 48%, Africa 45% and the Middle East an estimated 36%. South America's increase was only 5.7%, reinforcing that there is no universal post-2022 trajectory. The industrial gains are even more concentrated because the largest spenders are not always the largest producers.[1]
United States: the principal industrial centre, with visible bottlenecks
The United States spent $954 billion on its military in 2025, one third of the global total. The figure was 7.5% below 2024 largely because no new supplemental appropriation comparable with previous Ukraine-related packages was added, not because the underlying industrial cycle had reversed. US companies in the SIPRI Top 100 generated approximately $334 billion in arms revenue in 2024, almost half of the global ranking, and benefit not only from domestic procurement but from European, Asian and Middle Eastern demand.[1][3]
The scale of the US ecosystem is also a source of complexity. The Department of Defense depends on more than 200,000 suppliers but has incomplete visibility into the origin of many components, according to the Government Accountability Office. Shipbuilding programmes face workforce, yard-capacity and supplier constraints, while missile expansion depends on a narrow group of rocket-motor, seeker and energetic-material producers. A large budget can protect prime contractors from demand risk, but it cannot instantly manufacture specialist labour or replace a sole-source component.[19]
The United States is therefore likely to capture a large share of the global boom while simultaneously paying to repair weaknesses created by decades of consolidation. The emerging solution combines multi-year contracts, direct investment in suppliers, second-source qualification and greater allied co-production. Its success should be measured in delivered annual output and shorter lead times, rather than the nominal value of contract announcements.
European Union and wider Europe: the fastest budget shift
Europe is the most visible post-2022 rearmament region. Total European military expenditure reached $864 billion in 2025, 14% higher than in 2024 and 102% higher than in 2016 in real terms. Germany spent $114 billion, Poland $46.8 billion and Spain $40.2 billion, with all three recording large annual increases. European NATO members together spent $559 billion under SIPRI's methodology, while NATO's separate constant-2021-dollar measure placed European Allies and Canada above $571 billion.[1][6]
The change is reaching company accounts. Rheinmetall reported 2025 sales of EUR 9.94 billion, 29% above the previous year, and a backlog of EUR 63.8 billion. BAE Systems ended the year with a record backlog of roughly GBP 84 billion. European defence turnover and investment are rising, but the continent still has fragmented specifications, overlapping programmes and an uneven ability to place multi-year joint orders. National preferences can preserve domestic skills while limiting production scale.[20]
The EU's SAFE lending instrument and wider Readiness 2030 framework can support joint purchasing and industrial capacity, but their headline values are enabling mechanisms rather than guaranteed factory revenue. The most important practical signal will be the share converted into firm orders for common configurations. If Europe maintains demand certainty and aggregates purchasing, the current cycle could produce a larger, more competitive industrial base. If procurement remains fragmented or shifts heavily to imports, European budgets may strengthen military capability without capturing the full economic return.
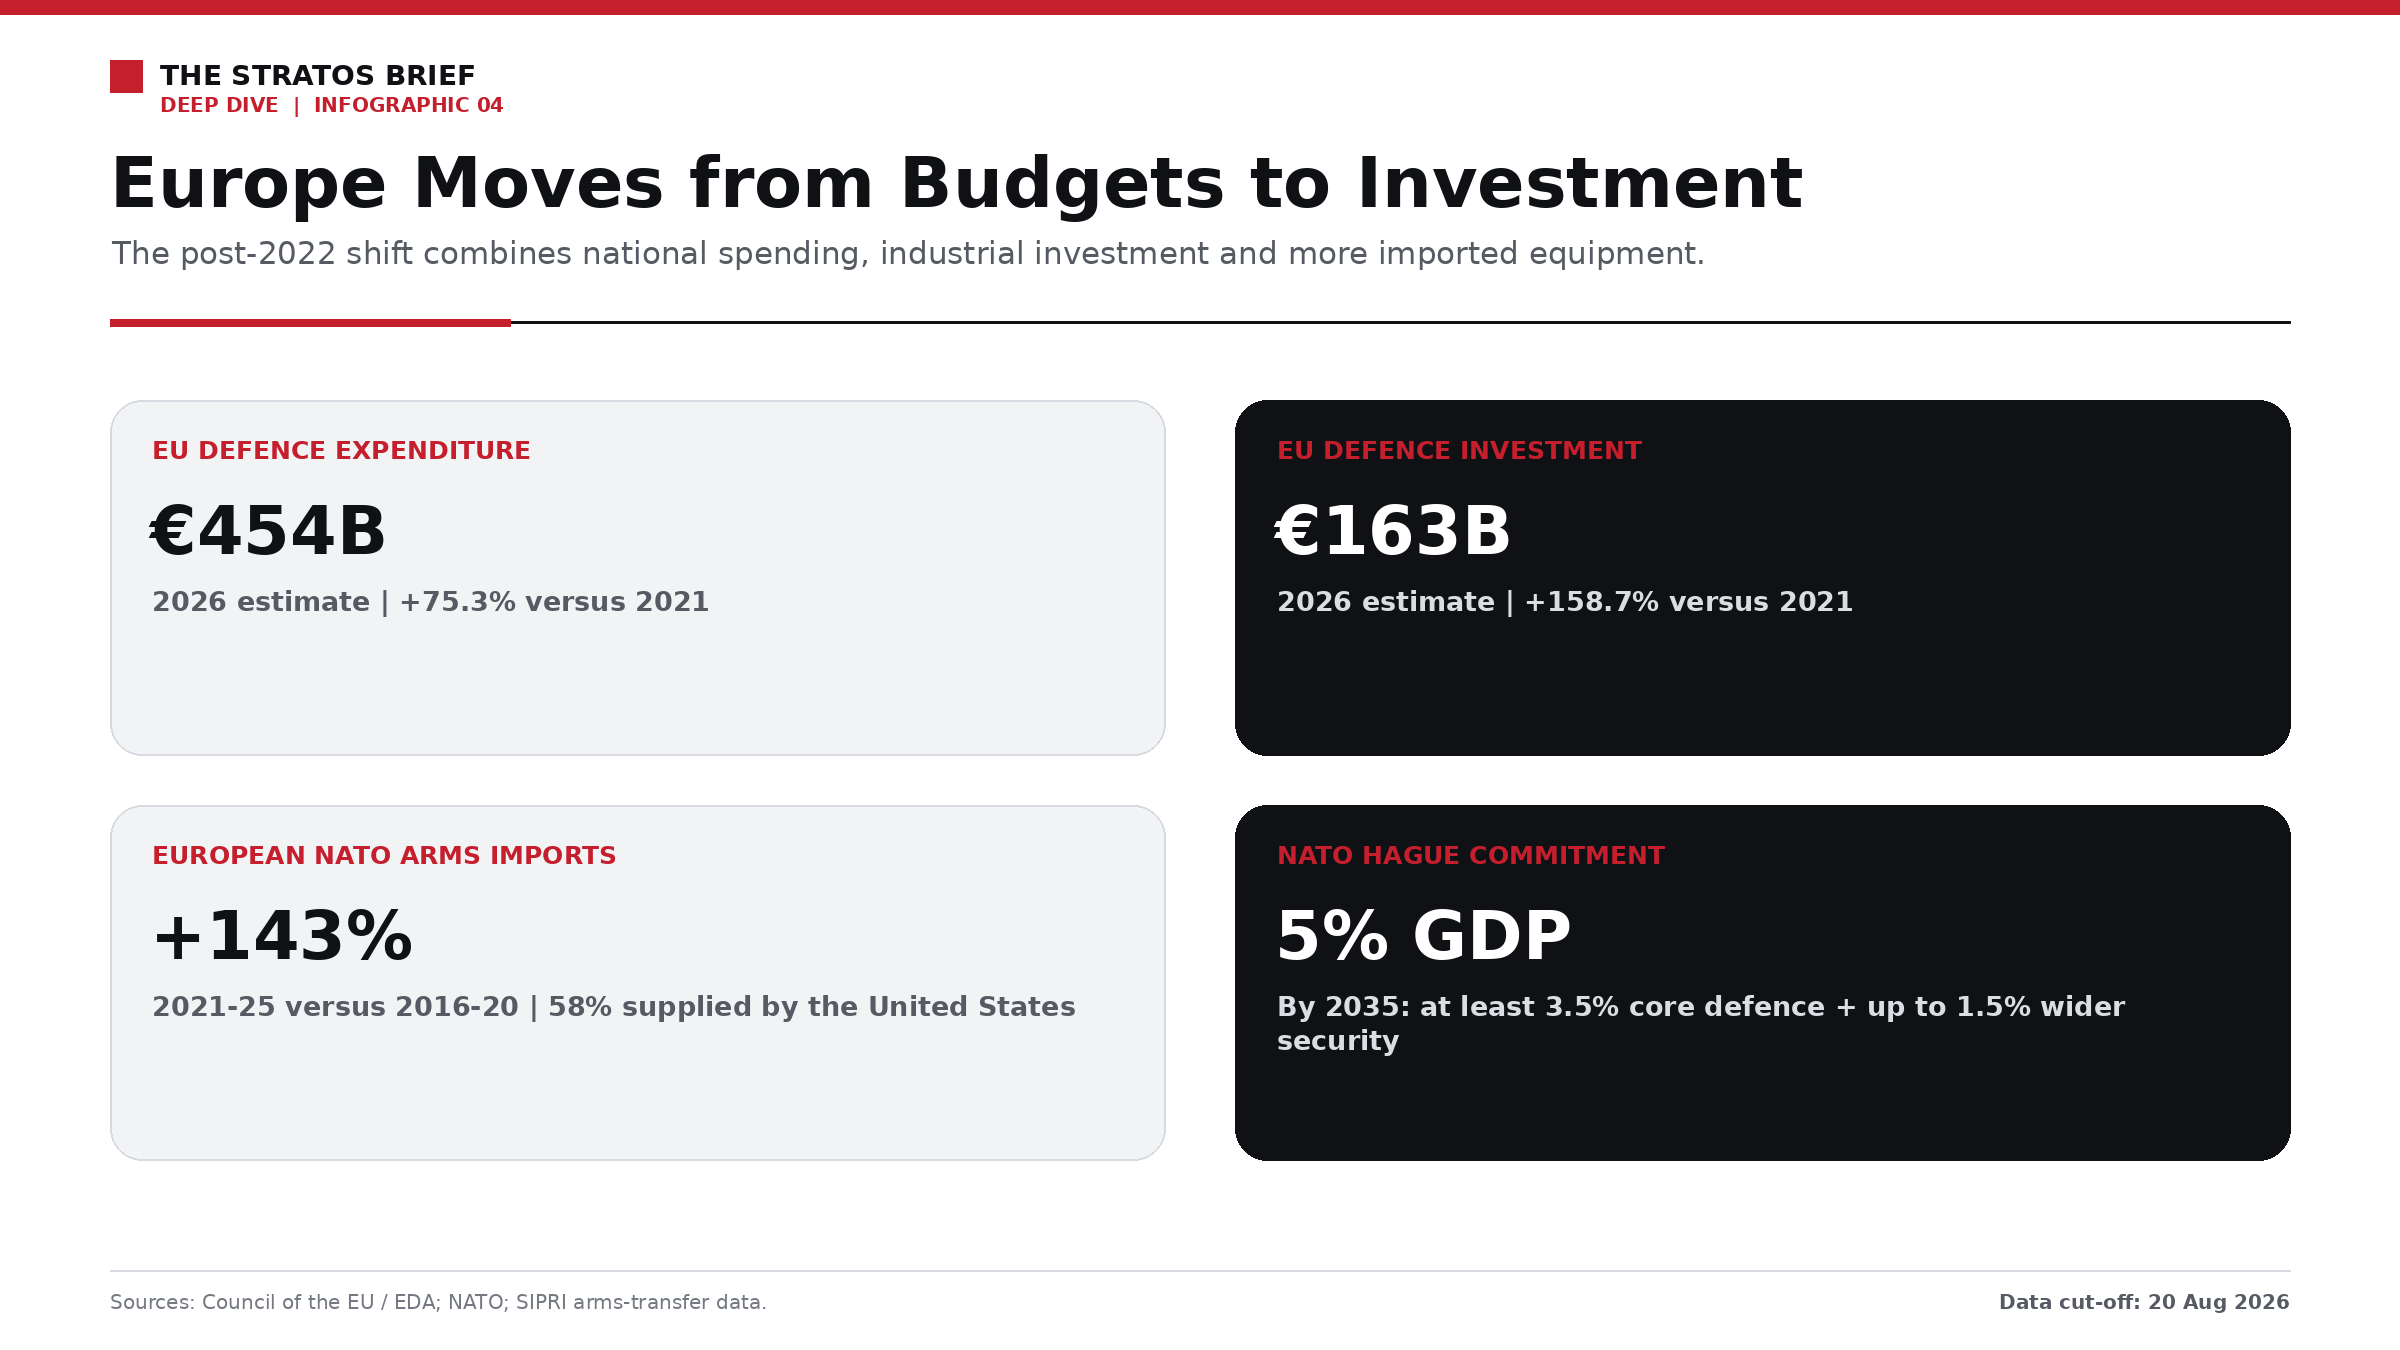
Europe's defence shift is visible in budgets, investment and imports. EU defence investment is estimated to be almost 159% higher in 2026 than in 2021, while European NATO members have also increased purchases from foreign suppliers.
Ukraine: rapid innovation under extreme fiscal pressure
Ukraine combines exceptional industrial learning with exceptional economic strain. Its producers have developed drones, navigation solutions, electronic-warfare techniques and software at a pace that conventional acquisition systems rarely achieve. Combat provides immediate performance data and rewards modular, repairable designs. This makes Ukrainian companies attractive partners for European and US groups seeking operationally validated technology.
The same environment limits normal commercial development. Facilities and energy networks are vulnerable, export policy must balance revenue against domestic need, and the state cannot finance all available capacity while sustaining the wider war economy. Ukraine's future role could range from a heavily subsidised domestic arsenal to a major European centre for drones, missiles and battlefield software. The determining factor will be whether wartime innovation is translated into financeable standards, intellectual-property arrangements and production partnerships that survive after the most intense demand recedes.
Russia: output growth alongside overheating and opacity
Russia's military expenditure reached an estimated $190 billion in 2025, equivalent to 7.5% of GDP and 20% of government spending under SIPRI's internationally comparable measure. A more detailed assessment of the federal budget placed total military expenditure at almost RUB 16 trillion, or approximately 38% of planned government expenditure. The apparent difference illustrates the importance of definitions, classified categories and exchange-rate effects rather than a simple contradiction.[1][10]
Domestic demand has supported high-volume production of drones, missiles, ammunition and repaired vehicles, while sanctions have encouraged alternative procurement routes for foreign technology. These routes have not prevented output, but they have increased costs and uncertainty. The two Russian companies for which SIPRI could compile Top 100 data recorded combined arms revenue of $31.2 billion in 2024, 23% higher than in 2023; the small number of included firms reflects limited transparency rather than a complete picture of the industry.[3]
The industrial benefit is accompanied by macroeconomic pressure. SIPRI describes an overheated economy, labour shortages, high interest rates and a 2025 federal deficit of 2.6% of GDP. Spending connected with debt service and subsidised credit increased from 4% of government expenditure in 2022 to 14% in the 2025 budget. The 2026 budget initially planned a real reduction in military spending to RUB 14.9 trillion, or 6.3% of GDP, although higher oil prices following the Iran conflict could ease the fiscal constraint and prompt amendments. Russia demonstrates how defence output can support selected factories while imposing costs through inflation, labour scarcity, borrowing and weaker civilian activity.[10]
China: a structural cycle rather than a Ukraine cycle
China spent an estimated $336 billion in 2025, 7.4% more than in 2024 and 62% more than in 2016, while maintaining a military burden of approximately 1.7% of GDP. Its expansion is driven primarily by long-term force modernisation, regional competition, nuclear development, maritime power and the objective of comprehensive modernisation by 2035. Ukraine has provided lessons, but it is not the principal cause of China's trend.[1]
China is also a useful warning against treating budget growth as a guarantee of near-term corporate growth. The eight Chinese companies in the SIPRI Top 100 recorded $88.3 billion in arms revenue in 2024, a 10% decline linked to contract delays and cancellations amid corruption allegations. At the same time, China has reduced reliance on imports and occupies important positions in global supply chains for critical minerals, electronics and industrial inputs. Its defence policy can therefore affect other producers not only through military competition, but through access to materials and manufacturing equipment.[3][21]
India: moving from buyer toward builder
India's military expenditure reached $92.1 billion in 2025, making it the world's fifth-largest spender. The country remains a major arms importer, but policy is deliberately shifting more value into domestic production. Government figures put defence output at INR 1.78 trillion in fiscal 2025/26, 15.6% above the previous year and 110% above fiscal 2020/21. Exports reached a record INR 384.24 billion, while the private sector accounted for 24% of production compared with 76% for public-sector organisations.[1][11]
The result is neither full self-sufficiency nor continued import dependence, but a hybrid model. India uses foreign purchases to close urgent capability gaps while applying localisation, licensing and domestic procurement to build capacity. It remained the world's second-largest importer of major arms in 2021-25, although imports declined and Russia's share fell to around 40%. The economic return will depend on whether local content develops beyond assembly into engines, sensors, materials and original design.
Japan: from constrained customer to allied production node
Japan spent $62.2 billion in 2025, 9.7% more than in 2024 and 61% more than in 2016, with its military burden reaching 1.4% of GDP, the highest level since 1958. Its fiscal 2026 defence-related budget totals approximately JPY 8.81 trillion, with major allocations for stand-off weapons, integrated air and missile defence, unmanned systems, ammunition, maintenance and resilient facilities.[1][12]
The industrial shift is visible in company data: the five Japanese firms in the SIPRI Top 100 increased combined arms revenue by 40% in 2024 to $13.3 billion. Japan is also expanding co-production and maintenance cooperation with the United States, including missile programmes. The opportunity is to turn a historically low-volume, high-unit-cost sector into an allied manufacturing node. The constraints include an ageing workforce, a weak yen that raises import costs and the difficulty of convincing suppliers that larger order volumes will persist.
Israel, South Korea and Turkey: export challengers with different advantages
Israel is indispensable to the Iran story because it combines high domestic wartime demand with a large export industry focused on missiles, air defence, sensors, drones and electronic systems. Its military expenditure was $48.3 billion in 2025, slightly lower than in 2024 but 120% above 2016. Defence exports reached a record $19.2 billion, almost 30% above 2024, with missile, rocket and air-defence systems representing 29% of deal value. Operational use can increase foreign interest in demonstrated systems, although export restrictions, political risk and the need to prioritise domestic deliveries can complicate order fulfilment.[1][13]
South Korea offers a different proposition: established heavy industry, competitive delivery schedules and the willingness to provide local production or technology partnerships. Its four Top 100 companies increased arms revenue by 31% in 2024 to $14.1 billion, aided by demand from Europe. Turkey's five ranked companies generated $10.1 billion, 11% more than in 2023, with strengths in drones, missiles, vehicles and naval platforms. Both countries benefit when traditional US or European suppliers cannot meet delivery timelines, turning industrial availability into export market share.[3]
Gulf states and Iran: large buyers, uncertain Iranian data
The Middle East spent an estimated $218 billion in 2025, broadly unchanged from 2024 but 36% above 2016 in real terms. Saudi Arabia remained the region's largest spender at approximately $83.2 billion, equal to 6.5% of GDP, while the Gulf states continued to generate major demand for aircraft, air defence, missiles, sensors and maintenance. Their industrial strategies increasingly attach local assembly, technology transfer and domestic-company participation to foreign purchases, although imported platforms still account for a large share of the capability and economic value.[1]
Iran presents the opposite data problem. SIPRI estimated 2025 military expenditure at $7.4 billion, down 5.6% in real terms, but also cautioned that off-budget financing and high inflation make the total unusually difficult to measure. Iranian industry has developed missiles, drones and naval systems under sanctions and with limited access to conventional suppliers, yet the 2026 strikes damaged parts of that infrastructure just as foreign demand for systems intended to counter Iranian weapons accelerated. The resulting industrial benefit is therefore asymmetric: Iran may need to reconstruct capacity, while US, Israeli and allied producers receive replenishment and air-defence orders.
The Gulf also connects the defence cycle to energy. Higher hydrocarbon prices can expand fiscal space for exporters and indirectly support both additional procurement and sovereign investment, while the same price movement weakens energy-importing economies. The Iran conflict can consequently improve the budget position of some major arms buyers and of Russia even as it raises the wider global cost of the war.
Africa: rising expenditure, limited industrial capture
African military expenditure reached $58.2 billion in 2025, 8.5% above 2024 and 45% above 2016. The continental figure is highly concentrated: Algeria alone spent $25.4 billion, or roughly 44% of the total, equal to 8.8% of its GDP and 25% of government expenditure. Morocco spent $6.3 billion, Nigeria $2.1 billion after a 55% annual increase, and South Africa $3.2 billion after a further decline.[1]
This is not a uniform African rearmament boom. Major-arms imports to Africa actually fell by 41% between 2016-20 and 2021-25, influenced heavily by a reduction in Algerian imports, while Morocco moved in the opposite direction. Domestic production exists in countries including South Africa, Egypt, Algeria, Morocco and Nigeria, but much of the continent's procurement still sends industrial value abroad. For states with limited fiscal space, high import content means the security benefit may be real while the domestic multiplier is small and pressure on foreign exchange, debt or public services is larger.[7]
South America: selective modernisation, not a regional boom
South America spent $56.3 billion in 2025, only 5.7% more in real terms than in 2016. Brazil accounted for $23.9 billion and Colombia $14.5 billion, while Guyana increased expenditure amid its dispute with Venezuela over Essequibo. Compared with Europe or East Asia, the region is not experiencing a broad post-2022 rearmament cycle.[1]
Its industrial story is instead concentrated in selective export niches. Brazil's Embraer has gained international momentum with the KC-390 transport aircraft, and regional firms retain capabilities in aircraft, vehicles, ammunition and naval construction. This illustrates that a country can benefit from the global cycle even when its home region is not rearming rapidly. Export success, however, should not be confused with a general rise in South American defence demand.
The industrial dividend
The most direct economic beneficiaries are defence primes, but much of the value flows through less visible suppliers: metal processors, chemical plants, electronics manufacturers, software companies, construction firms, logistics providers and testing organisations. Long-term orders can justify new machinery and apprenticeships, while demand for energetic materials or rocket motors can revive facilities that had become marginal under peacetime purchasing. Communities near arsenals, shipyards and aerospace clusters can experience rising employment, wages and local tax revenue.
Defence research can also produce wider technological gains. Public investment in aviation, satellites, navigation, communications, advanced materials, semiconductors and computing has historically generated civilian applications. The present cycle is accelerating autonomy, low-cost sensing, resilient communications, cyber defence and manufacturing techniques. The strength of these spillovers depends on intellectual-property arrangements, competition and whether technology can move between military and civilian markets rather than remaining locked inside classified programmes.
The macroeconomic effect is positive in the short term on average, but not fixed. The IMF's historical analysis estimates a defence-spending multiplier close to one, meaning that an additional unit of spending has typically produced an output increase of similar magnitude, yet the range is wide. The multiplier tends to be larger when spending is domestic, persistent and deficit-financed during periods of spare capacity, and smaller when equipment is imported, monetary policy tightens or a temporary programme offers too little certainty for companies to invest.[4]
There is also a benefit that conventional economic accounting cannot capture adequately: the expected value of security, resilience and deterrence. Stockpiles appear economically idle until they prevent coercion or allow a country to sustain operations. Redundant suppliers appear inefficient until one source fails. A neutral assessment should therefore avoid judging defence exclusively by the peacetime commercial return on capital. The relevant question is whether the chosen capability provides sufficient security value for its full economic and fiscal cost.
The bill beyond defence
The common statement that every additional dollar for weapons removes one dollar from schools or hospitals is too simple. Governments can pay through higher taxes, borrowing, lower spending elsewhere or a combination of all three. Economic growth can absorb part of the burden, and a domestically produced system returns some expenditure through wages, profits and taxes. The trade-off nevertheless becomes more severe as programmes persist, borrowing costs rise or the economy reaches capacity.
The IMF finds that a typical historical defence boom increased outlays by about 2.7 percentage points of GDP over more than two and a half years, with roughly two thirds financed through higher deficits. On average, the fiscal deficit deteriorated by 2.6 percentage points of GDP and public debt rose by approximately seven percentage points within three years. The average boom did not automatically reduce social spending, but booms financed mainly by reprioritisation produced substantial cuts to social protection, health and education. Wartime booms were more costly: public debt increased by around 14 percentage points and real social expenditure fell regardless of the financing mix.[4]
Higher defence demand can also crowd out private activity without an explicit budget cut. Engineers hired by a missile producer are unavailable to energy, aviation or infrastructure projects; scarce explosives, metals, chips and machine tools become more expensive; and debt-financed spending can contribute to higher interest rates. If central banks respond to inflation, housing, business investment and government debt service all become more costly. Russia's recent experience provides a concentrated example, but the mechanism can affect any economy operating near capacity.
Import-dependent countries face an additional external constraint. Purchasing a foreign aircraft or missile can provide capability quickly, yet much of the employment and tax benefit accrues abroad while the buyer's current account and foreign-exchange position weaken. Offsets and local assembly can retain some value, although they sometimes increase cost or create facilities without enough follow-on demand. The economic quality of defence spending therefore depends as much on procurement design as on its nominal size.
The Iran conflict adds a global transmission channel through energy and commodities. Higher oil and gas prices can improve the budget position of exporters such as Russia or Gulf states while raising costs for importers. Fertiliser and transport price increases feed into food prices, household purchasing power and industrial competitiveness. Those effects are not defence expenditure in a national budget, but they are part of the economic bill generated by the conflict that stimulated the new arms orders.
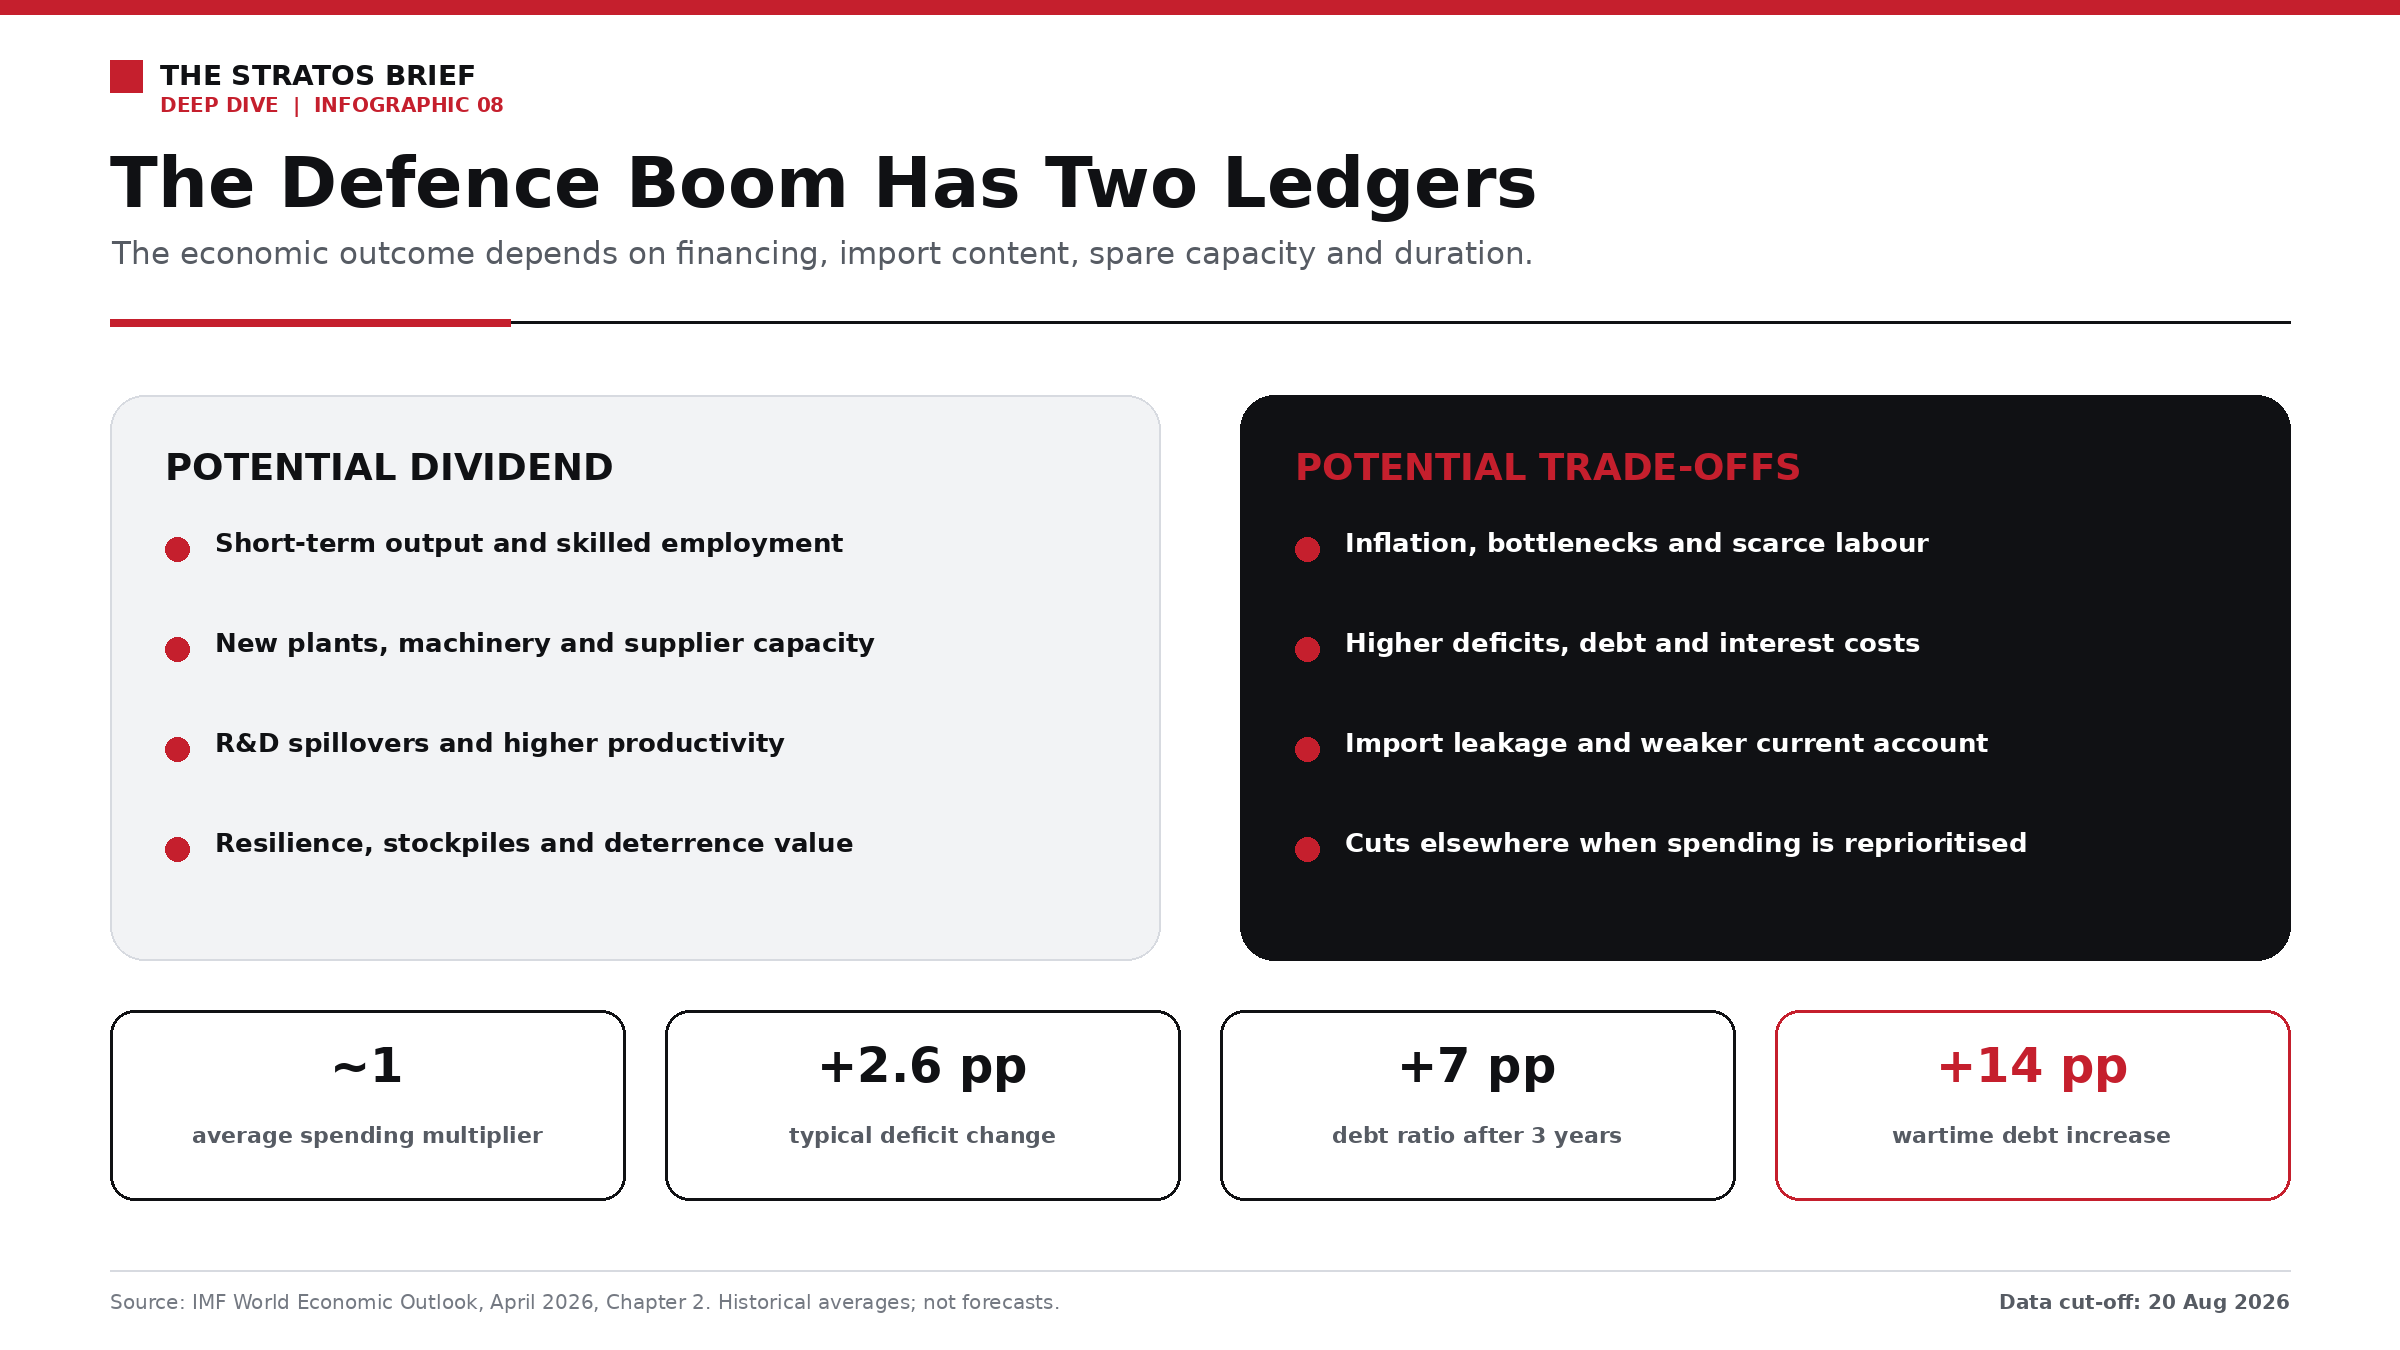
Defence expansion can support output, employment, capital formation and innovation, but it can also increase inflation, debt and import leakage. IMF historical results show that financing and wartime conditions strongly affect the balance.
An importer's arms boom is an exporter's industrial boom
Two countries can increase military expenditure by the same amount and experience very different economic results. A country purchasing domestically manufactured ammunition may support local chemical production, machine tools, transport and engineering, with part of the spending returning through taxation. A country importing a complete system can obtain military capability more rapidly but export most of the immediate industrial stimulus. The distinction helps explain why US, Israeli, South Korean and Turkish producers can benefit from European rearmament even when their own national expenditure grows more slowly.
Domestic content is not an all-or-nothing category. A foreign platform may include local maintenance, licensed assembly, component manufacturing, software integration or future export work. Joint production can diversify supply and create political resilience, but it may also reduce economies of scale if every customer demands a separate national line. Procurement policy must balance delivery speed, interoperability, strategic dependence, unit cost and industrial learning rather than assuming that the highest local-content percentage is automatically optimal.
The strongest long-term outcome is usually a credible division of labour supported by predictable demand. Countries do not need to manufacture every component, but they do need visibility into critical dependencies and alternatives when a supplier is disrupted. The post-2022 cycle is encouraging allied production networks, yet export controls, national-security restrictions and competition for priority deliveries can still divide those networks precisely when demand is highest.
Why money cannot instantly become missiles
Defence manufacturing has unusually high barriers to expansion. Energetic materials require specialised plants, environmental approvals and rigorous safety systems. Rocket motors and seekers need long qualification cycles. Naval shipyards combine enormous infrastructure with trades that take years to train. Electronics must meet security and reliability standards that commercial substitutes may not satisfy. Even when a second supplier exists, changing a component can require a weapon to be tested and certified again.
Capital investment also needs confidence that demand will persist. A company asked to triple output for two years may prefer overtime and incremental equipment rather than build a facility that could become stranded after a ceasefire. Multi-year contracts reduce that risk, but they transfer more demand risk to government. If geopolitical conditions improve, taxpayers may continue paying for capacity that is no longer urgently required; if governments refuse long commitments, the capacity may never be built.
Critical-material policy adds another layer. China holds important positions in processing several minerals and industrial inputs used across electronics and advanced manufacturing. Export restrictions or politically motivated supply controls can raise costs even for weapons assembled entirely in Europe or North America. Attempts to create national self-sufficiency improve resilience but may sacrifice scale and increase prices. A practical industrial strategy identifies the components for which redundancy is worth paying and those that can remain within diversified international markets.[21]
The decisive performance indicators are therefore physical rather than rhetorical: missiles delivered per year, artillery rounds accepted to standard, shipyard throughput, lead-time reduction, new qualified suppliers and the conversion of backlog into revenue without escalating unit costs. A large budget that produces mainly cost inflation is not the same as a large increase in capability.
Three paths to 2030
Scenario 1: Replenishment peak
Under the first scenario, fighting in Ukraine and the Middle East de-escalates, governments rebuild minimum stockpiles and the most urgent production contracts reach their peak before the end of the decade. Defence budgets remain above their pre-2022 levels, but fiscal pressure encourages slower procurement and cancellation of marginal capacity projects. Companies with diversified commercial businesses absorb the transition more easily, while recently created ammunition and drone firms face consolidation.
Signals for this path would include falling supplemental appropriations, shorter contract durations, declining capital expenditure by major producers, lower backlog growth and political decisions to postpone the 3.5% core NATO target. It would not return the industry to 2021, because stocks, threat assessments and industrial-resilience requirements have changed, but it would turn the boom into a large replacement cycle rather than a permanent mobilisation.
Scenario 2: Structural rearmament
In the second scenario, Europe implements its spending commitments, the United States maintains higher munitions capacity, and Asian modernisation continues even if active conflicts ease. Long-term orders support factories beyond replenishment, while governments treat stockpiles, dual sourcing and defence infrastructure as permanent insurance. Ukraine becomes integrated into the European industrial system, and Japan, South Korea, India, Turkey and Israel expand their roles as production and technology partners.
Evidence would include firm multi-year appropriations rather than aspirational ceilings, sustained procurement near or above 3.5% of GDP among NATO members, higher R&D and capital investment, and production targets that convert into delivered output. This is the scenario most likely to generate durable jobs and technological spillovers, but it also locks in a larger recurring fiscal claim that must compete with ageing populations, climate adaptation, healthcare and debt service.
Scenario 3: Multi-theatre scarcity
The third scenario involves simultaneous or recurring demand from Ukraine, the Middle East and the Indo-Pacific. Stockpiles remain under pressure, governments prioritise deliveries between theatres, and the most constrained components command premium prices. High-end interceptors, long-range missiles, drones, propellants and shipyard capacity become strategic bottlenecks. Export controls and restrictions on critical materials fragment supply chains further.
This path produces the strongest headline growth for selected manufacturers but not necessarily the best economic outcome. Inflation, energy disruption, debt and uncertainty would erode civilian investment, while governments might pay more for each unit without closing capability gaps quickly. The observable signs would be repeated emergency transfers, falling allied delivery volumes, accelerating unit costs, export restrictions and operational consumption that continues to exceed annual production.
The boom is real. Its final shape is not.
The global defence industry has entered its most consequential expansion cycle in decades. World military expenditure is already roughly one quarter higher in real terms than in 2021, Europe has shifted from incremental increases toward major investment, Ukraine has created an extraordinary wartime production ecosystem, and the 2026 Iran conflict has pushed the United States and its suppliers toward multi-year expansion of high-end missile capacity. China, India, Japan, South Korea, Israel and Turkey are strengthening distinct industrial models, while Africa and South America show why the global headline cannot be applied uniformly.
The central fact is that expenditure has moved faster than production. Much of the prospective growth remains stored in contract ceilings, backlogs, factory projects and political commitments that may take years to convert into deliveries. The industry's long-term winners will not necessarily be the companies with the largest announcements, but those able to expand output, control unit costs, secure critical inputs and maintain demand after the immediate emergency fades.
The same distinction is necessary when judging the wider economy. Defence spending can support employment, innovation and resilience, and the security it purchases has value that GDP does not fully measure. It can also increase debt, inflation and import dependence or displace civilian priorities, especially during war and in countries with limited fiscal space. The outcome depends on financing, domestic industrial content, economic capacity and procurement design rather than on a universal rule that defence spending is either beneficial or wasteful.
Ukraine created the first rearmament shock by proving that modern war still consumes enormous quantities of equipment. Iran created the second by demonstrating that even the most advanced inventories can be depleted faster than specialised production can replace them. Whether these shocks produce a temporary replenishment wave or a permanent reordering of the global economy will be decided not by budgets alone, but by the factories, suppliers and political commitments that remain in place when the current wars no longer dominate the headlines.
Sources and methodology
Figures are the latest available as of 20 August 2026. Monetary totals are presented in current prices unless a real or constant-price comparison is explicitly stated. Bracketed SIPRI country estimates retain the uncertainty of the underlying source. Contract ceilings, budget requests, forecasts and production targets are identified as such and are not treated as realised expenditure or revenue.
SIPRI, Trends in World Military Expenditure, 2025: https://www.sipri.org/sites/default/files/2026-04/2604_milex_2025.pdf
SIPRI, Trends in World Military Expenditure, 2021: https://www.sipri.org/publications/2022/sipri-fact-sheets/trends-world-military-expenditure-2021
SIPRI, Top 100 Arms-producing and Military Services Companies, 2024 and Arms Industry Database: https://www.sipri.org/publications/2025/sipri-fact-sheets/sipri-top-100-arms-producing-and-military-services-companies-2024
IMF, World Economic Outlook, April 2026, Chapter 2 - Defense Spending: Macroeconomic Consequences and Trade-Offs: https://www.imf.org/-/media/files/publications/weo/2026/april/english/ch2.pdf
Council of the European Union / European Defence Agency, EU Defence in Numbers: https://www.consilium.europa.eu/en/policies/defence-numbers/
NATO, Defence Investment and NATO's 5% Commitment: https://www.nato.int/en/what-we-do/introduction-to-nato/defence-expenditures-and-natos-5-commitment
SIPRI, Global Arms Flows Jump as European Demand Soars: https://www.sipri.org/media/press-release/2026/global-arms-flows-jump-nearly-10-cent-european-demand-soars
President of Ukraine, Our Defense Production Potential Has Surpassed $35 Billion: https://www.president.gov.ua/en/news/volodimir-zelenskij-nash-potencial-u-sferi-oboronnogo-virobn-98617
SIPRI, The Transformation of Ukraine's Arms Industry Amid War with Russia: https://www.sipri.org/commentary/topical-backgrounder/2025/transformation-ukraines-arms-industry-amid-war-russia
SIPRI, A Budget for a Fifth Year of War: Military Spending in Russia's Budget for 2026: https://www.sipri.org/sites/default/files/2026-03/2026_01_russias_military_budget_for_2026.pdf
Government of India, Press Information Bureau, The Defence Decade: https://www.pib.gov.in/PressReleasePage.aspx?PRID=2273854&lang=1®=3
Japan Ministry of Defense, FY2026 Budget: https://www.mod.go.jp/en/d_act/d_budget/pdf/fy2026_20251226a.pdf
Israel Ministry of Defense, All-Time Defense Export Record: Israel Crosses the $19 Billion Threshold: https://mod.gov.il/en/press-releases/press-room/all-time-defense-export-record-israel-crosses-the-19-billion-threshold
US Department of War, Operation Epic Fury: https://www.war.gov/Spotlights/Operation-Epic-Fury/
Reuters, US Strikes $58.6 Billion Patriot Missile Deal Amid Rising Stockpile Concerns, 29 July 2026: https://www.reuters.com/business/aerospace-defense/army-awards-lockheed-martin-586-billion-largest-ever-pac-3-patriot-missile-deal-2026-07-29/
US Department of War, Contracts for 24 June 2026 - THAAD: https://www.war.gov/News/Contracts/Contract/Article/4525817/contracts-for-june-24-2026/
US Department of War, Department and RTX Accelerate Critical Munitions Production Through Navy: https://www.war.gov/News/Releases/Release/Article/4573544/department-of-war-and-rtx-accelerate-critical-munitions-production-through-navy/
World Bank, Middle East War to Spark Biggest Energy Price Surge in Four Years: https://www.worldbank.org/en/news/press-release/2026/04/28/commodity-markets-outlook-april-2026-press-release
US Government Accountability Office, Defense Industrial Base: Actions Needed to Improve Visibility into Supply Chains: https://www.gao.gov/products/gao-25-107283
Rheinmetall, Annual Report 2025: https://www.rheinmetall.com/en/media/news-watch/news/2026/03/2026-03-11-rheinmetall-presents-annual-report-for-2025
SIPRI Yearbook 2026, Arms Production and Military Services: https://www.sipri.org/yearbook/2026/06